The seemingly divergent views on key issues like the direction of interest rates, inflation, the stock market, and the impact of artificial intelligence (AI) have led to “mixed emotions” in the market. The Rolling Stones’ top 10 hit of the same name was released in 1989, a year that saw the fall of the Berlin Wall, the Exxon Valdez oil spill, and the bursting of the Japanese asset bubble. Ultimately, the S&P 500 Index returned over 30% in 1989, but investors were rather apathetic on stocks. Ed Mathias, managing director of T. Rowe Price, quipped at the time: “It is a kind of joyless prosperity.”
Thus far, 2023 feels a bit similar. While most major markets are up on the year, there are plenty of issues to worry about, from the geopolitical like the Russia-Ukraine war and Chinese policy, to monetary concerns and a Federal Reserve (Fed) did not raise interest rates at their last meeting but seems likely to continue raising interest rates in the months ahead given their “skip” language as opposed to a pause or stop of the current rate hike cycle. Within markets, venture capital valuations have come back down to Earth and commercial real estate seems to be the next slow-moving train wreck on the horizon.
Despite this backdrop, equity markets continued to climb higher. For the quarter, global equity markets, as measured by the MSCI All Country World Index, returned 6.2%. Year to date, they have returned nearly 14%. Underlying the broad equity market returns was quite a bit of dispersion and concentration. For example, the Russell 1000 Growth Index has posted a 29% return, while the Russell 2000 Value Index has seen a 2.5% return year to date. Bonds, real assets, and diversifying strategies broadly were all flat on the quarter, with the Bloomberg U.S. Aggregate Bond, S&P Real Assets Equity, and HFRX Global Hedge Indices all moving +/-0.5% or less, respectively.
KEY MARKET THEMES AND DEVELOPMENTS
Recession Postponed?
A prevailing theme throughout 2022 and early 2023 was the growing narrative of a looming economic downturn, which, when combined with the sharp rise in interest rates, helped place downward pressure on the major traditional asset classes and categories amid the most aggressive Fed tightening campaign in four decades.
A cursory review of market performance over the first half of 2023 paints a starkly different picture, however, with the major asset classes seemingly missing the memo on the looming doom and gloom and posting strong gains. In fact, the year-to-date rally across risk assets has been so strong that domestic large cap equities such as the S&P 500 Index ended the quarter within spitting distance of the all-time high, which was established on the first trading day of 2022.
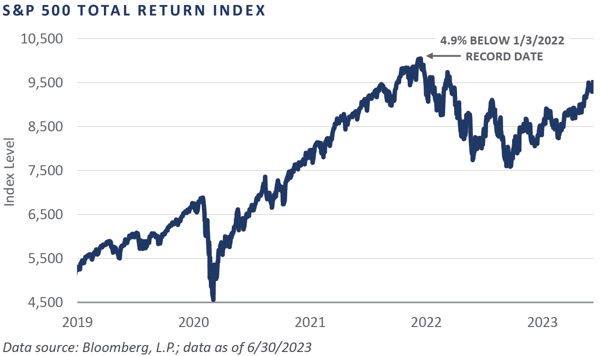
The year-to-date rally has been led by U.S. equities but has not been broad-based. Through the first six months of the year, U.S. large cap equities (S&P 500) posted a 16.9% total return. Comparatively, U.S. small cap (Russell 2000) returned 8.1%, U.S. microcap (Russell Microcap) returned 2.3%, international developed (MSCI EAFE) returned 11.7%, and emerging markets (MSCI Emerging Markets) returned 4.9%.
Mega cap technology companies were a standout outperformer through the first half of 2023, with the S&P 500 Information Technology Index posting a staggering 42.8% total return for the first six months of the year. Conversely, the more cyclical and value-oriented sectors such as energy and financials saw total returns of -5.6% and -0.5%, respectively.
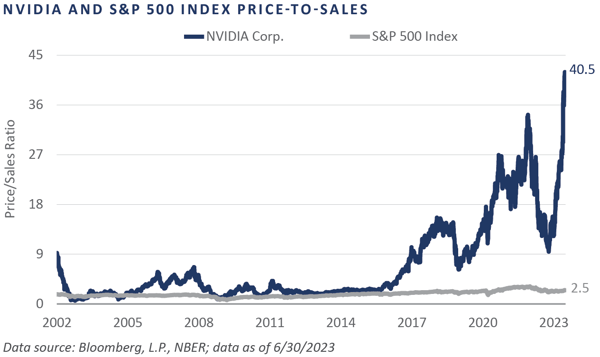
A related theme highlighting the disperse performance backdrop is significant gains witnessed among companies engaged in the development and advancement of AI technology. NVIDIA Corporation (NYSE: NVDA), a U.S.-based multinational leader in the design, development, and production of three-dimensional graphics processors and related software, witnessed a greater than 50% gain in its share price during the quarter, which helped to launch some of the company’s valuation levels into orbit.
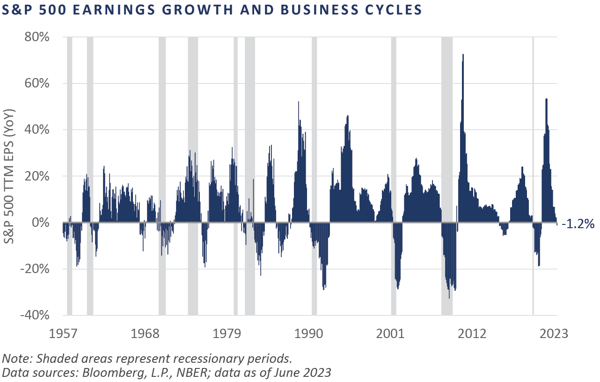
Perhaps the AI revolution will aid not only in propelling the human race forward, but also preserving historically lofty profit margins across U.S. large cap companies, which remained near the upper end of their historical range through quarter, with the S&P 500 Index sporting a 10% net income margin through June, versus a record high of 13.2% put-in at the peak of the market in January 2022. Moreover, the buildout and societal acceptance of AI applications is expected to help support the earnings growth of U.S. companies, the pace of which unfortunately lost considerable momentum through the first half of 2023.
Private Equity Speed Bump
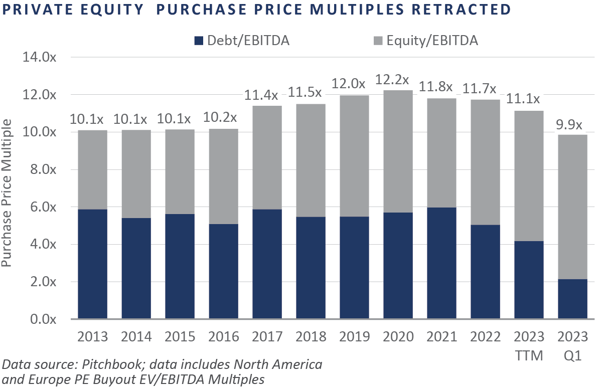
There were “mixed emotions” in private equity over the quarter as well. Economic headwinds, tighter credit conditions, and concerns about valuations stymied fundraising, investment, and exit volumes. Within buyout deals, both purchase price multiples and debt usage declined meaningfully.
Venture capital has seen a precipitous decline in pre-money valuations and a sharp slowdown in investment activity.
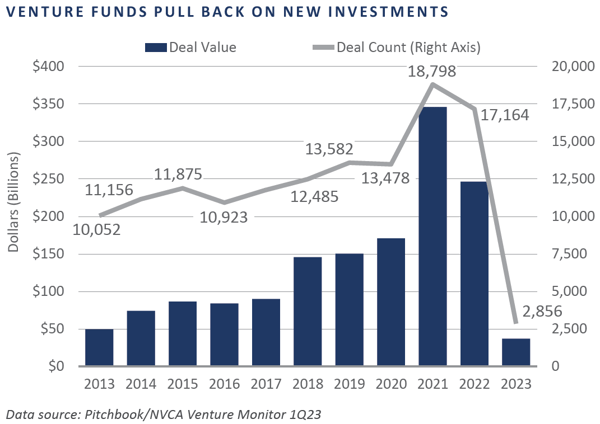
Ultimately, the long-term trend of private markets being a meaningful part of most long-term pools of capital seems to be intact. The markets are currently in a soft patch of their inevitable ups and downs. As such, it would not be surprising if both capital call and distribution activity becomes muted for the next few quarters.
Not Out of the Woods
With the window for a soft U.S. economic landing seemingly opening during the second quarter, the threat of a downturn in business activity appears to have taken a backseat. After all, if the economy were truly on the verge of tipping into recession, surely performance across the financial markets would appear vastly different than that experienced over the trailing two quarters. Indeed, investors have traversed a fairly steep “wall of worry” over the past 18 months, leading some to believe that not only is the economy more resilient than anticipated before the Fed embarked on their tightening campaign, but also that risk asset valuations are seemingly immune to an increasingly higher cost of capital.
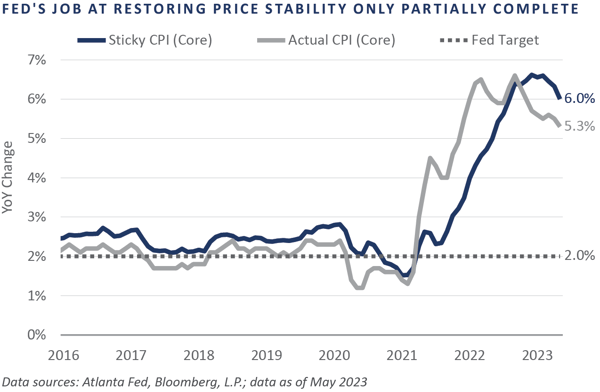
To date, several major financial institutions have failed, the Russia-Ukraine war has dragged on, the rate-sensitive sectors of the economy have turned down—e.g., housing, autos, commercial real estate—the manufacturing sector has spent much of the past eight months in contraction, the U.S. government nearly triggered a default on its sovereign debt obligations, and the Fed’s task of restoring price stability appears only partially complete.
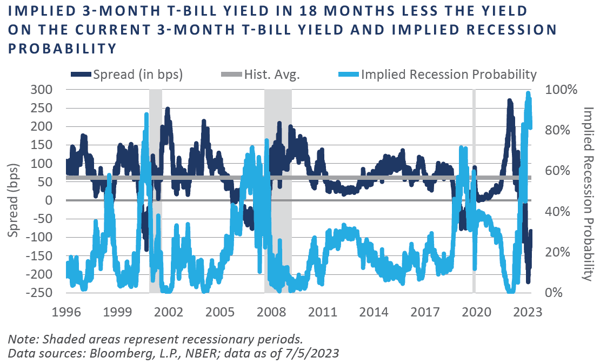
Moreover, as the Fed has worked since March 2022 to engineer a modest amount of demand destruction through quantitative tightening and a 500-basis point increase to the policy rate, bond market participants have taken note, resulting in one of the deepest inversions in the shape of the Treasury yield curve in more than 40 years. Consequently, market-based measures of a downturn in the economy over the coming 12 months have surged, with odds implied by the deeply inverted slope of the near-term forward spread—i.e., the implied 3-month T-bill yield in 18 months less the yield on the current 3-month T-bill yield—increasing to nearly 100% during the quarter.
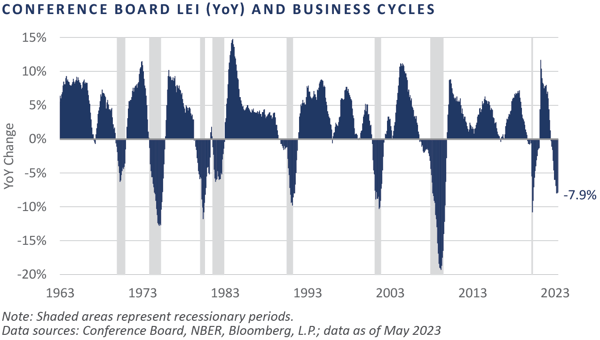
While current economic and financial market conditions appear favorable at first glance, prospective business conditions—and potentially risk premia—could face meaningful downward pressure, should the Conference Board’s gauge of leading economic indicators indeed result in the business cycle downturn the current bleak growth rate is implying. Through May, this composite of economic factors aimed at foreshadowing turns in the business cycle exhibited the weakest annual growth rate without the economy in recession in the more than 60-year history of the index, at -7.9%.
Since the Global Financial Crisis, investors have followed the adage: “Don’t fight the Fed.” As the banking system crisis unfolded in March, bond market positioning pointed to an elevated likelihood the Fed would pivot from their current tightening path and begin slashing rates before the year was over, a supportive backdrop for sectors relatively more reliant on cheap money. As incoming economic data has surprised to the upside and inflation, particularly core inflation, has remained stubbornly elevated—albeit on a downward trajectory—recent changes in bond market positioning have pushed out the prospect for an easing in Fed policy until 2024.
While the first half of 2023 presented asset allocators with little to complain about from an absolute returns perspective, the near-term outlook has remained largely unchanged, resulting in “mixed emotions.” Performance has been strong and shorter-term positive momentum measures imply little tendency for this trend to change, yet fundamental headwinds remain elevated and most risk assets are valued materially above historical averages. Against this mixed backdrop, FEG has been slow to put forth meaningful portfolio shifts until a clearer outlook emerges.
Reflections and Outlook
Last quarter’s market commentary included a suggestion to review investment policy statements (IPS), with a particular focus on strategic asset allocation and ability to accept illiquidity. We view this as classic advice which, much like classic rock and roll, never goes out of style.
Tactically and within IPS parameters, given the current environment of “mixed emotions,” FEG is not planning to make any large moves. We believe risk premiums offered by equity, credit, or real assets do not seem to warrant loading up on risk at this point in the cycle. On the margin, the safety and fair yield of Treasuries seem perfectly acceptable.
However, FEG strives to remain ever vigilant in monitoring asset class valuations, fundamentals, and sentiment based on a strong belief in markets and the entrepreneurship and creativity of business owners. As such, the FEG investment team is constantly on the lookout for opportunities to increase risk and add to equities. In the famous words of Mic Jagger and The Rolling Stones, “You can’t always get what you want, but if you try sometimes, you just might find, you get what you need.”
DISCLOSURES
This report was prepared by FEG (also known as Fund Evaluation Group, LLC), a federally registered investment adviser under the Investment Advisers Act of 1940, as amended, providing non-discretionary and discretionary investment advice to its clients on an individual basis. Registration as an investment adviser does not imply a certain level of skill or training. The oral and written communications of an adviser provide you with information about which you determine to hire or retain an adviser. Fund Evaluation Group, LLC, Form ADV Part 2A & 2B can be obtained by written request directly to: Fund Evaluation Group, LLC, 201 East Fifth Street, Suite 1600, Cincinnati, OH 45202, Attention: Compliance Department.
The information herein was obtained from various sources. FEG does not guarantee the accuracy or completeness of such information provided by third parties. The information in this report is given as of the date indicated and believed to be reliable. FEG assumes no obligation to update this information, or to advise on further developments relating to it. FEG, its affiliates, directors, officers, employees, employee benefit programs and client accounts may have a long position in any securities of issuers discussed in this report.
Bloomberg Index Services Limited. BLOOMBERG® is a trademark and service mark of Bloomberg Finance L.P. and its affiliates (collectively “Bloomberg”). Bloomberg or Bloomberg’s licensors own all proprietary rights in the Bloomberg Indices. Bloomberg does not approve or endorse this material or guarantee the accuracy or completeness of any information herein, nor does Bloomberg make any warranty, express or implied, as to the results to be obtained therefrom, and, to the maximum extent allowed by law, Bloomberg shall not have any liability or responsibility for injury or damages arising in connection therewith
Index performance results do not represent any managed portfolio returns. An investor cannot invest directly in a presented index, as an investment vehicle replicating an index would be required. An index does not charge management fees or brokerage expenses, and no such fees or expenses were deducted from the performance shown.
The Chartered Financial Analyst® (CFA) designation is a professional certification issued by the CFA Institute to qualified financial analysts who: (i) have a bachelor’s degree and four years of professional experience involving investment decision making or four years of qualified work experience[full time, but not necessarily investment related]; (ii) complete a self‐study program (250 hours of study for each of the three levels); (iii) successfully complete a series of three six‐hour exams; and (iv) pledge to adhere to the CFA Institute Code of Ethics and Standards of Professional Conduct.
The Chartered Alternative Investment Analyst Association® is an independent, not‐for‐profit global organization committed to education and professionalism in the field of alternative investments. Founded in 2002, the CAIA Association is the sponsoring body for the CAIA designation. Recognized globally, the designation certifies one's mastery of the concepts, tools and practices essential for understanding alternative investments and promotes adherence to high standards of professional conduct.
Neither the information nor any opinion expressed in this report constitutes an offer, or an invitation to make an offer, to buy or sell any securities.
Any return expectations provided are not intended as, and must not be regarded as, a representation, warranty or predication that the investment will achieve any particular rate of return over any particular time period or that investors will not incur losses.
Diversification or Asset Allocation does not assure or guarantee better performance and cannot eliminate the risk of investment loss.
Past performance is not indicative of future results.
This blog is prepared for informational purposes only. It does not address specific investment objectives, or the financial situation and the particular needs of any person who may receive this report.
INDICES
The Alerian MLP Index is a composite of the 50 most prominent energy Master Limited Partnerships that provides investors with an unbiased, comprehensive benchmark for this emerging asset class.
The HFRI Monthly Indices (HFRI) are equally weighted performance indexes, compiled by Hedge Fund Research Inc., and are utilized by numerous hedge fund managers as a benchmark for their own hedge funds. The HFRI are broken down into 37 different categories by strategy, including the HFRI Fund Weighted Composite, which accounts for over 2000 funds listed on the internal HFR Database. The HFRI Fund of Funds Composite Index is an equal weighted, net of fee, index composed of approximately 800 fund of funds which report to HFR. See www.hedgefundresearch.com for more information on index construction.
The MSCI ACWI (All Country World Index) Index is a free float-adjusted market capitalization weighted index that is designed to measure the equity market performance of developed and emerging markets. The MSCI ACWI consists of 47 country indexes comprising 23 developed and 24 emerging market country indexes. The developed market country indexes included are: Australia, Austria, Belgium, Canada, Denmark, Finland, France, Germany, Hong Kong, Ireland, Israel, Italy, Japan, Netherlands, New Zealand, Norway, Portugal, Singapore, Spain, Sweden, Switzerland, the United Kingdom and the United States. The emerging market country indexes included are: Brazil, Chile, China, Colombia, Czech Republic, Egypt, Greece, Hungary, India, Indonesia, Korea, Kuwait, Malaysia, Mexico, Peru, Philippines, Poland, Qatar,Saudi Arabia, South Africa, Taiwan, Thailand, Turkey, and United Arab Emirates.
The S&P 500 Index is a capitalization-weighted index of 500 stocks. The S&P 500 Index is designed to measure performance of the broad domestic economy through changes in the aggregate market value of 500 stocks representing all major industries.
Information on any indices mentioned can be obtained either through your advisor or by written request to information@feg.com.
Second Quarter 2023 Market Commentary: Mixed Emotions
The seemingly divergent views on key issues like the direction of interest rates, inflation, the stock market, and the impact of artificial intelligence (AI) have led to “mixed emotions” in the market. The Rolling Stones’ top 10 hit of the same name was released in 1989, a year that saw the fall of the Berlin Wall, the Exxon Valdez oil spill, and the bursting of the Japanese asset bubble. Ultimately, the S&P 500 Index returned over 30% in 1989, but investors were rather apathetic on stocks. Ed Mathias, managing director of T. Rowe Price, quipped at the time: “It is a kind of joyless prosperity.”
Thus far, 2023 feels a bit similar. While most major markets are up on the year, there are plenty of issues to worry about, from the geopolitical like the Russia-Ukraine war and Chinese policy, to monetary concerns and a Federal Reserve (Fed) did not raise interest rates at their last meeting but seems likely to continue raising interest rates in the months ahead given their “skip” language as opposed to a pause or stop of the current rate hike cycle. Within markets, venture capital valuations have come back down to Earth and commercial real estate seems to be the next slow-moving train wreck on the horizon.
Despite this backdrop, equity markets continued to climb higher. For the quarter, global equity markets, as measured by the MSCI All Country World Index, returned 6.2%. Year to date, they have returned nearly 14%. Underlying the broad equity market returns was quite a bit of dispersion and concentration. For example, the Russell 1000 Growth Index has posted a 29% return, while the Russell 2000 Value Index has seen a 2.5% return year to date. Bonds, real assets, and diversifying strategies broadly were all flat on the quarter, with the Bloomberg U.S. Aggregate Bond, S&P Real Assets Equity, and HFRX Global Hedge Indices all moving +/-0.5% or less, respectively.
KEY MARKET THEMES AND DEVELOPMENTS
Recession Postponed?
A prevailing theme throughout 2022 and early 2023 was the growing narrative of a looming economic downturn, which, when combined with the sharp rise in interest rates, helped place downward pressure on the major traditional asset classes and categories amid the most aggressive Fed tightening campaign in four decades.
A cursory review of market performance over the first half of 2023 paints a starkly different picture, however, with the major asset classes seemingly missing the memo on the looming doom and gloom and posting strong gains. In fact, the year-to-date rally across risk assets has been so strong that domestic large cap equities such as the S&P 500 Index ended the quarter within spitting distance of the all-time high, which was established on the first trading day of 2022.
The year-to-date rally has been led by U.S. equities but has not been broad-based. Through the first six months of the year, U.S. large cap equities (S&P 500) posted a 16.9% total return. Comparatively, U.S. small cap (Russell 2000) returned 8.1%, U.S. microcap (Russell Microcap) returned 2.3%, international developed (MSCI EAFE) returned 11.7%, and emerging markets (MSCI Emerging Markets) returned 4.9%.
Mega cap technology companies were a standout outperformer through the first half of 2023, with the S&P 500 Information Technology Index posting a staggering 42.8% total return for the first six months of the year. Conversely, the more cyclical and value-oriented sectors such as energy and financials saw total returns of -5.6% and -0.5%, respectively.
A related theme highlighting the disperse performance backdrop is significant gains witnessed among companies engaged in the development and advancement of AI technology. NVIDIA Corporation (NYSE: NVDA), a U.S.-based multinational leader in the design, development, and production of three-dimensional graphics processors and related software, witnessed a greater than 50% gain in its share price during the quarter, which helped to launch some of the company’s valuation levels into orbit.
Perhaps the AI revolution will aid not only in propelling the human race forward, but also preserving historically lofty profit margins across U.S. large cap companies, which remained near the upper end of their historical range through quarter, with the S&P 500 Index sporting a 10% net income margin through June, versus a record high of 13.2% put-in at the peak of the market in January 2022. Moreover, the buildout and societal acceptance of AI applications is expected to help support the earnings growth of U.S. companies, the pace of which unfortunately lost considerable momentum through the first half of 2023.
Private Equity Speed Bump
There were “mixed emotions” in private equity over the quarter as well. Economic headwinds, tighter credit conditions, and concerns about valuations stymied fundraising, investment, and exit volumes. Within buyout deals, both purchase price multiples and debt usage declined meaningfully.
Venture capital has seen a precipitous decline in pre-money valuations and a sharp slowdown in investment activity.
Ultimately, the long-term trend of private markets being a meaningful part of most long-term pools of capital seems to be intact. The markets are currently in a soft patch of their inevitable ups and downs. As such, it would not be surprising if both capital call and distribution activity becomes muted for the next few quarters.
Not Out of the Woods
With the window for a soft U.S. economic landing seemingly opening during the second quarter, the threat of a downturn in business activity appears to have taken a backseat. After all, if the economy were truly on the verge of tipping into recession, surely performance across the financial markets would appear vastly different than that experienced over the trailing two quarters. Indeed, investors have traversed a fairly steep “wall of worry” over the past 18 months, leading some to believe that not only is the economy more resilient than anticipated before the Fed embarked on their tightening campaign, but also that risk asset valuations are seemingly immune to an increasingly higher cost of capital.
To date, several major financial institutions have failed, the Russia-Ukraine war has dragged on, the rate-sensitive sectors of the economy have turned down—e.g., housing, autos, commercial real estate—the manufacturing sector has spent much of the past eight months in contraction, the U.S. government nearly triggered a default on its sovereign debt obligations, and the Fed’s task of restoring price stability appears only partially complete.
Moreover, as the Fed has worked since March 2022 to engineer a modest amount of demand destruction through quantitative tightening and a 500-basis point increase to the policy rate, bond market participants have taken note, resulting in one of the deepest inversions in the shape of the Treasury yield curve in more than 40 years. Consequently, market-based measures of a downturn in the economy over the coming 12 months have surged, with odds implied by the deeply inverted slope of the near-term forward spread—i.e., the implied 3-month T-bill yield in 18 months less the yield on the current 3-month T-bill yield—increasing to nearly 100% during the quarter.
While current economic and financial market conditions appear favorable at first glance, prospective business conditions—and potentially risk premia—could face meaningful downward pressure, should the Conference Board’s gauge of leading economic indicators indeed result in the business cycle downturn the current bleak growth rate is implying. Through May, this composite of economic factors aimed at foreshadowing turns in the business cycle exhibited the weakest annual growth rate without the economy in recession in the more than 60-year history of the index, at -7.9%.
Since the Global Financial Crisis, investors have followed the adage: “Don’t fight the Fed.” As the banking system crisis unfolded in March, bond market positioning pointed to an elevated likelihood the Fed would pivot from their current tightening path and begin slashing rates before the year was over, a supportive backdrop for sectors relatively more reliant on cheap money. As incoming economic data has surprised to the upside and inflation, particularly core inflation, has remained stubbornly elevated—albeit on a downward trajectory—recent changes in bond market positioning have pushed out the prospect for an easing in Fed policy until 2024.
While the first half of 2023 presented asset allocators with little to complain about from an absolute returns perspective, the near-term outlook has remained largely unchanged, resulting in “mixed emotions.” Performance has been strong and shorter-term positive momentum measures imply little tendency for this trend to change, yet fundamental headwinds remain elevated and most risk assets are valued materially above historical averages. Against this mixed backdrop, FEG has been slow to put forth meaningful portfolio shifts until a clearer outlook emerges.
Reflections and Outlook
Last quarter’s market commentary included a suggestion to review investment policy statements (IPS), with a particular focus on strategic asset allocation and ability to accept illiquidity. We view this as classic advice which, much like classic rock and roll, never goes out of style.
Tactically and within IPS parameters, given the current environment of “mixed emotions,” FEG is not planning to make any large moves. We believe risk premiums offered by equity, credit, or real assets do not seem to warrant loading up on risk at this point in the cycle. On the margin, the safety and fair yield of Treasuries seem perfectly acceptable.
However, FEG strives to remain ever vigilant in monitoring asset class valuations, fundamentals, and sentiment based on a strong belief in markets and the entrepreneurship and creativity of business owners. As such, the FEG investment team is constantly on the lookout for opportunities to increase risk and add to equities. In the famous words of Mic Jagger and The Rolling Stones, “You can’t always get what you want, but if you try sometimes, you just might find, you get what you need.”
DISCLOSURES
This report was prepared by FEG (also known as Fund Evaluation Group, LLC), a federally registered investment adviser under the Investment Advisers Act of 1940, as amended, providing non-discretionary and discretionary investment advice to its clients on an individual basis. Registration as an investment adviser does not imply a certain level of skill or training. The oral and written communications of an adviser provide you with information about which you determine to hire or retain an adviser. Fund Evaluation Group, LLC, Form ADV Part 2A & 2B can be obtained by written request directly to: Fund Evaluation Group, LLC, 201 East Fifth Street, Suite 1600, Cincinnati, OH 45202, Attention: Compliance Department.
The information herein was obtained from various sources. FEG does not guarantee the accuracy or completeness of such information provided by third parties. The information in this report is given as of the date indicated and believed to be reliable. FEG assumes no obligation to update this information, or to advise on further developments relating to it. FEG, its affiliates, directors, officers, employees, employee benefit programs and client accounts may have a long position in any securities of issuers discussed in this report.
Bloomberg Index Services Limited. BLOOMBERG® is a trademark and service mark of Bloomberg Finance L.P. and its affiliates (collectively “Bloomberg”). Bloomberg or Bloomberg’s licensors own all proprietary rights in the Bloomberg Indices. Bloomberg does not approve or endorse this material or guarantee the accuracy or completeness of any information herein, nor does Bloomberg make any warranty, express or implied, as to the results to be obtained therefrom, and, to the maximum extent allowed by law, Bloomberg shall not have any liability or responsibility for injury or damages arising in connection therewith
Index performance results do not represent any managed portfolio returns. An investor cannot invest directly in a presented index, as an investment vehicle replicating an index would be required. An index does not charge management fees or brokerage expenses, and no such fees or expenses were deducted from the performance shown.
The Chartered Financial Analyst® (CFA) designation is a professional certification issued by the CFA Institute to qualified financial analysts who: (i) have a bachelor’s degree and four years of professional experience involving investment decision making or four years of qualified work experience[full time, but not necessarily investment related]; (ii) complete a self‐study program (250 hours of study for each of the three levels); (iii) successfully complete a series of three six‐hour exams; and (iv) pledge to adhere to the CFA Institute Code of Ethics and Standards of Professional Conduct.
The Chartered Alternative Investment Analyst Association® is an independent, not‐for‐profit global organization committed to education and professionalism in the field of alternative investments. Founded in 2002, the CAIA Association is the sponsoring body for the CAIA designation. Recognized globally, the designation certifies one's mastery of the concepts, tools and practices essential for understanding alternative investments and promotes adherence to high standards of professional conduct.
Neither the information nor any opinion expressed in this report constitutes an offer, or an invitation to make an offer, to buy or sell any securities.
Any return expectations provided are not intended as, and must not be regarded as, a representation, warranty or predication that the investment will achieve any particular rate of return over any particular time period or that investors will not incur losses.
Diversification or Asset Allocation does not assure or guarantee better performance and cannot eliminate the risk of investment loss.
Past performance is not indicative of future results.
This blog is prepared for informational purposes only. It does not address specific investment objectives, or the financial situation and the particular needs of any person who may receive this report.
INDICES
The Alerian MLP Index is a composite of the 50 most prominent energy Master Limited Partnerships that provides investors with an unbiased, comprehensive benchmark for this emerging asset class.
The HFRI Monthly Indices (HFRI) are equally weighted performance indexes, compiled by Hedge Fund Research Inc., and are utilized by numerous hedge fund managers as a benchmark for their own hedge funds. The HFRI are broken down into 37 different categories by strategy, including the HFRI Fund Weighted Composite, which accounts for over 2000 funds listed on the internal HFR Database. The HFRI Fund of Funds Composite Index is an equal weighted, net of fee, index composed of approximately 800 fund of funds which report to HFR. See www.hedgefundresearch.com for more information on index construction.
The MSCI ACWI (All Country World Index) Index is a free float-adjusted market capitalization weighted index that is designed to measure the equity market performance of developed and emerging markets. The MSCI ACWI consists of 47 country indexes comprising 23 developed and 24 emerging market country indexes. The developed market country indexes included are: Australia, Austria, Belgium, Canada, Denmark, Finland, France, Germany, Hong Kong, Ireland, Israel, Italy, Japan, Netherlands, New Zealand, Norway, Portugal, Singapore, Spain, Sweden, Switzerland, the United Kingdom and the United States. The emerging market country indexes included are: Brazil, Chile, China, Colombia, Czech Republic, Egypt, Greece, Hungary, India, Indonesia, Korea, Kuwait, Malaysia, Mexico, Peru, Philippines, Poland, Qatar,Saudi Arabia, South Africa, Taiwan, Thailand, Turkey, and United Arab Emirates.
The S&P 500 Index is a capitalization-weighted index of 500 stocks. The S&P 500 Index is designed to measure performance of the broad domestic economy through changes in the aggregate market value of 500 stocks representing all major industries.
Information on any indices mentioned can be obtained either through your advisor or by written request to information@feg.com.
Recent posts
Subscribe to blog