The recent trend of concentration in stock market returns reached staggering new heights in the second quarter, with Nvidia, Microsoft, and Apple accounting for roughly 20% of the S&P 500 index and increasing to a combined market capitalization of $9.7 trillion through quarter-end. For perspective, that is roughly one third of the U.S. gross domestic product of approximately $28 trillion! Several groupings and acronyms for high-flying growth stocks have evolved over time—e.g., FANG, FANMAG, Magnificent Seven—and the persistent success of these three stocks in particular has earned them a new in-house moniker, the “Ten Trillion Dollar Trio.”
The Ten Trillion Dollar Trio achieved their staggering market cap through a combination of strong growth and lofty valuations, Nvidia in particular. The maker of chips essential for the artificial intelligence (AI) boom, Nvidia is an excellent example of being in the right place at the right time. Over the past 12 months, Nvidia’s market cap has seen stunning growth, going from $1 trillion to $3 trillion. Moreover, there is a lot of good news currently priced into the stock, which is trading at 40x forward earnings according to FactSet.
Zooming out to broader markets, global equities, as measured by the MSCI All Country World Index, returned a modest 2.9% in the second quarter. Returns were largely fueled by U.S. large cap growth stocks as well as the aforementioned Ten Trillion Dollar Trio. The Russell 1000 Growth Index—i.e., large cap growth—returned 8.3%, while value and small cap stocks were negative on the quarter. Outside of equities, markets were less exciting during the quarter. Bonds and diversifying strategies eked out modest gains of 0.1% and 0.4%, respectively, as measured by the Bloomberg U.S. Aggregate Bond Index and the HFRI Global Hedge Fund Index. Real assets experienced a decline, with the S&P Real Assets Equity Index posting a quarterly drop of 1.4%.
KEY MARKET THEMES AND DEVELOPMENTS
U.S. Large Cap Equities Unfazed by Economic Slowdown Pressures as
S&P 500 Ascends to Record High
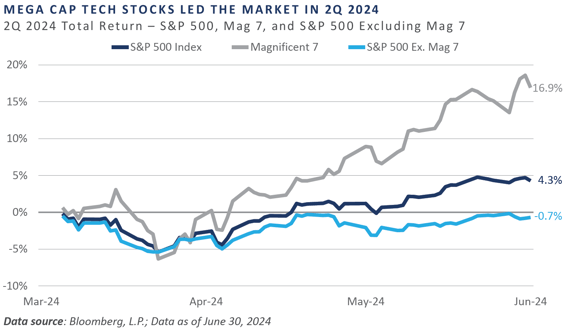
Despite stumbling out of the gates early in the quarter, the S&P 500 Index quickly regained its footing to post a 4.3% total return, adding to an impressive year-to-date gain of 15.3% and setting fresh record high levels along the way.
Indeed, the Bloomberg Magnificent 7 Index posted a 16.9% total return for the quarter and a staggering 37.0% for the first half of the year, versus mediocre performance by the remaining 493 constituents of the S&P 500, which saw a decline of 0.7% in the second quarter and a relatively more modest return of 8.6% for the first half of 2024.
Nvidia, a key global supplier of microchips essential to the adoption and proliferation of AI, has had an outsized influence on the concentration of the run-up in U.S. large cap stocks, with a gain of 36.7% in the second quarter following an 82.5% return in the first quarter. Needless to say, the incredible rise in Nvidia’s stock price caused some pain for portfolio managers and allocators who were underweight the stock—or worse yet, who did not own the company and its ilk versus either the cap-weighted index or growth-oriented peers.
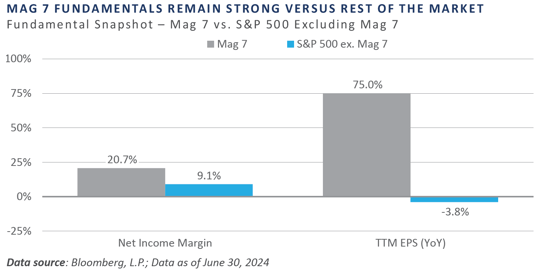
Of course, it behooves investors to not only focus on the prices and valuations attached to the tech-related companies that stand to benefit from the AI boom, but also seek to understand the fundamental picture. Using the same Bloomberg Mag 7 Index data mentioned above and based on available data as of 6/30/2024, there is little comparison between the profitability (net income margin) and earnings growth (trailing 12 months year-over-year growth) for the Mag 7 versus the rest of the market.
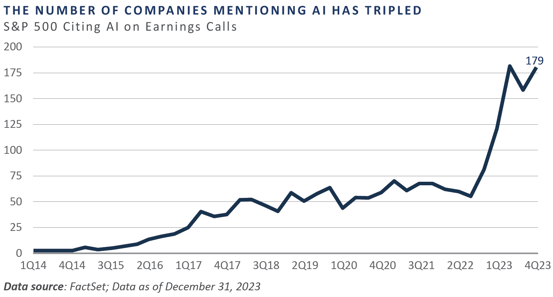
Corporate America has also increasingly searched for how to best incorporate AI into their business models or, at a minimum, to better understand AI’s impact on their business lines, customers, and employees. This is evidenced in the number of mentions of AI during S&P 500 companies’ quarterly earnings calls, which has grown sharply since 2022.
The relentless rise in U.S. large cap stocks over the trailing two-year period stirs mixed emotions. On the one hand, the stock market has long been considered a barometer for the overall health, well-being, and general sentiment of both corporate America and consumers. Indeed, many financial market datasets—including consumer sentiment surveys, leading economic indicators, and financial conditions—utilize the stock market to some degree as a variable in the construction of their respective data series.
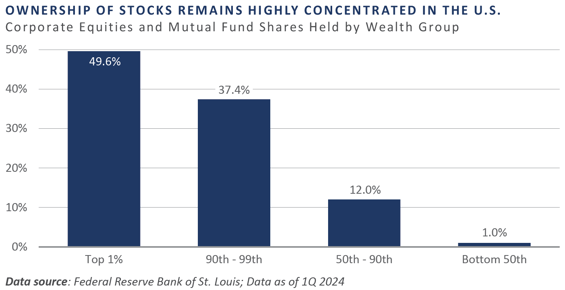
Moreover, when considering the vast wealth held by retail and institutional investors, sovereign entities, and money managers, one could logically surmise robust stock market performance is the rising tide that lifts all boats. However, just as much of the boom witnessed in the S&P 500 in recent years has been concentrated in a handful of names, the ownership of stocks by the country’s various wealth cohort groups has also clustered in a relatively small number of hands.
As of the first quarter 2024, data from the Federal Reserve Bank of St. Louis shows the top 10% of the wealth distribution owned an astonishing 87% of corporate equities and mutual fund shares, and the top 1% enjoyed nearly a 50% ownership share. The bottom 90% of the wealth distribution, however, owned just 13%, including a paltry 1% ownership by the entire lower half.
Much of the dichotomy between the performances of the stock market and the broader economy in the post-pandemic period serves as a reminder that a large disconnect can sometimes form between Wall Street and Main Street, leading to an increased income and wealth divide and a catalyst for increased societal agitation. Having already reviewed the Wall Street side, now it is time to consider Main Street.
Akin to the performance disparities witnessed across the equity markets in recent years, the U.S. economy has displayed similar conflicting signals. Much like U.S. large cap growth stocks have displayed immense leadership, the U.S. economy has enjoyed a similar position of relative strength.
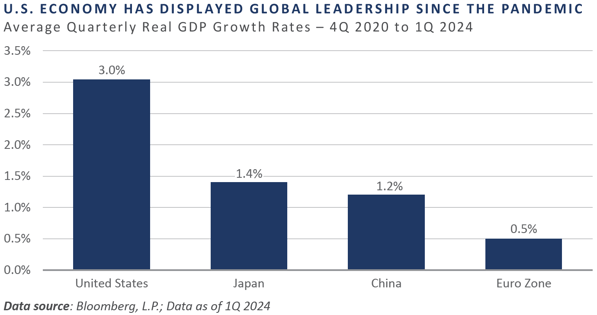
Looking at economic growth rates in the post-pandemic period, it is easy to see the impressive global leadership exhibited by the U.S. Since the fourth quarter of 2020 and as of first quarter 2024, quarterly real GDP growth in the U.S. has averaged a solid annualized pace of 3.0%. This significantly exceeds the growth rates of many the country’s key trading partners, with similar period readings of 1.4% by Japan, 1.2% by China, and just 0.5% for the euro zone.
On a relative basis, the U.S. has certainly been a standout performer. But much like in the financial markets, considering both the absolute level and the rate-of-change—i.e., “stock versus flow”—is a critical characteristic of a comprehensive analysis.
There is little doubt the absolute reading of the U.S. economy appears in anything but sound standing, as risk assets generally remain bid, credit spreads are tight, inflation has been on a steady downward trajectory, the rise in interest rates has moderated, and the labor market has remained tight, at least up until this year. This seemingly Goldilocks set of conditions helps support the notion the Federal Reserve (Fed) has been successful in reversing the post-pandemic surge in inflation without significantly denting the labor market and broader economy.
As the Fed embarked on their tightening campaign in early 2022, a number of classic recessionary signals began to surface, including the inversion of the Treasury yield curve, a pronounced decline across leading economic indicators, a slump across consumer sentiment and consumer expectations for future conditions, and a manufacturing base mired in contraction since fall 2022. At least during this period, however, the labor market was on a general tightening bias.
The often-cited long and variable lags associated with Fed monetary policy appear to finally be emerging in the U.S. labor market. Nonfarm payrolls, while solid in absolute terms, have witnessed a steady growth rate decline over the trailing year, a notable divergence between the two separate monthly job readings—the establishment and household surveys—has grown since 2022, and the recent steady rise in the unemployment rate.
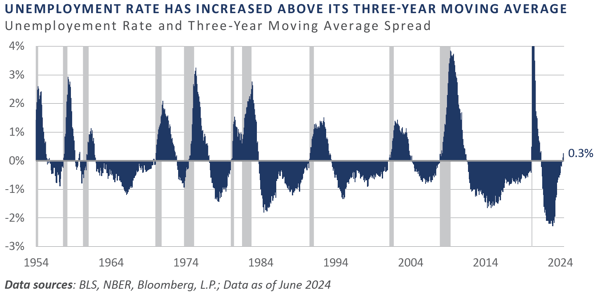
Through June, the unemployment rate stood at 4.1%, an absolute level that appears subdued by historical standards, but is showing a recent upward bias. Indeed, the 4.1% June rate stood 0.7 percentage points above the cyclical low established in January 2023. Perhaps more importantly, the reported rate has increased above its three-year moving average over the past two months, a signal that historically has been efficacious in helping determine the risks of a cyclical inflection in the economy.
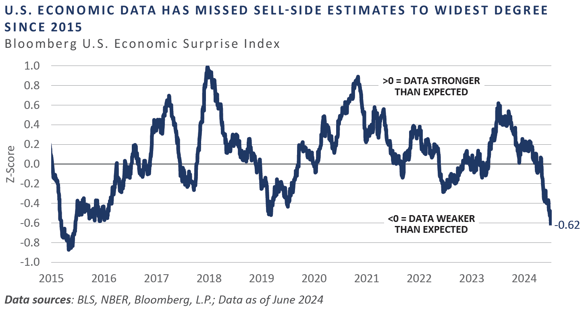
Another recent economic development which has caught the attention of investors is the underwhelming incoming economic data versus Wall Street sell-side estimates. The degree of “misses” displayed by incoming economic data versus that which has been priced into the market through sell-side consensus estimates has deteriorated at an unsettling rate thus far in 2024. Bloomberg’s U.S. Economic Surprise Index, for example, has slumped to a -0.6 z-score, representing the weakest string of incoming data relative to consensus estimates since 2015.
Hope remains, however, for a reversal of fortune in the economic datasets set to be released in the coming months, particularly if the Fed ultimately proves successful in engineering a soft landing—although a determination of that can likely only be made in confidence with the full benefit of hindsight. Hope also does not represent a sound investment strategy, and in light of the growing disparities in both the financial markets and the health of Wall Street versus Main Street, it remains prudent for investors to be on watch for abrupt changes that present both risks and opportunities and stand ready to tactically navigate those waters with precision and humility.
While much excitement has emanated from the public markets in recent quarters, it would be remiss not to comment on the private markets. Activity in the private equity markets has continued to experience a slower pace. Fundraising is on track to come in 18% below 2023 for buyout funds, and investing is off about 8%. While off recent highs, investing in family and founder-owned companies on Main Street is still occurring, though not at the levels seen in recent years. Similar to the public markets, the technology sector is driven by AI-related companies. In the first quarter of 2024, valuations for early-stage AI-related companies were 40% higher than for software companies. The biggest issue in the private equity market continues to be liquidity. With the IPO window generally closed and a limited number of M&A events, managers are looking for creative solutions in the secondary market. GP-led secondary sales were up over 20% in 2023 and are expected to continue growing through 2024.
Private credit funds are relatively more attractive today than they were a year ago. Pricing and terms have shifted strongly in favor of lenders across senior, unitranche, and mezzanine lending. Lenders are now able to provide capital to companies with lower leverage profiles at higher spreads and greater upfront fees than a year ago.
Real asset performance has been mixed in 2024 with AI again influencing market activity. AI applications require greater computing power and the use of AI applications is accelerating. This growth is straining the current data center market and pushing demand for power generation higher – tailwinds which could provide attractive investment opportunities. Higher interest rates and pressure in office space are causing headwinds for private real estate valuations as well as REITs.
REFLECTIONS AND OUTLOOK
As asset allocators, it is unusual to spend a significant amount of time on individual stocks, such as The Ten Trillion Dollar Trio; however, given the concentration by market cap and performance in a small number of stocks, it behooves one to carefully consider them. FEG believes these stocks to be an important part of a diversified portfolio and encourages clients to calibrate ownership relative to a stock’s weight in the market/index. Following this philosophy, on average, the investment team has been modestly underweight the largest handful of stocks in the index. Historically, big returns are made when one owns a stock before it skyrockets to a large weighting in the index rather than after that has occurred.
Of course, picking the winners in advance is no easy feat, so some level of humility and diversification is always a good thing. With that in mind, FEG continues to believe long-term investors’ strategic asset allocation should have a relatively constant risk posture (stocks) and illiquidity budget (private capital) that is prudently acceptable for their unique portfolio objectives. From that starting point, investors can tactically adjust to what the market offers up within investment policy statement (IPS) parameters.
Within public equity, FEG remains modestly underweight the largest stocks in the index, in favor of mid and small cap stocks. Some of this is top-down allocation, and some is through the use of active managers. On the fixed income side, corporate credit spreads are tight, and FEG favors a barbell posture of Treasury bonds and shorter duration positions in structured products and securitized assets. The name of the game in diversifying strategies and private capital is manager selection. The investment team is not willing to sacrifice quality when high conviction managers cannot be found but are quick to invest when such managers are accepting capital.
The team remains ever vigilant in monitoring markets and managers for new opportunities and risks to lean into or out of, respectively. It is also worth remembering that such events do not tend to happen regularly, therefore patience is essential. Small tweaks at the margins are reasonable to conduct more often, but big changes in the market that create the potential for bigger portfolio shifts are rare. Having the discipline to do nothing when there is nothing to do while also remaining nimble enough to react quickly to market volatility is a delicate balancing act. Doing this successfully and compounding capital over the long term is FEG’s goal, and the team remains steadfast in that pursuit. Thank you for your continued confidence and support of FEG.
DISCLOSURES
This report was prepared by FEG (also known as Fund Evaluation Group, LLC), a federally registered investment adviser under the Investment Advisers Act of 1940, as amended, providing non-discretionary and discretionary investment advice to its clients on an individual basis. Registration as an investment adviser does not imply a certain level of skill or training. The oral and written communications of an adviser provide you with information about which you determine to hire or retain an adviser. Fund Evaluation Group, LLC, Form ADV Part 2A & 2B can be obtained by written request directly to: Fund Evaluation Group, LLC, 201 East Fifth Street, Suite 1600, Cincinnati, OH 45202, Attention: Compliance Department.
The information herein was obtained from various sources. FEG does not guarantee the accuracy or completeness of such information provided by third parties. The information in this report is given as of the date indicated and believed to be reliable. FEG assumes no obligation to update this information, or to advise on further developments relating to it. FEG, its affiliates, directors, officers, employees, employee benefit programs and client accounts may have a long position in any securities of issuers discussed in this report.
Bloomberg Index Services Limited. BLOOMBERG® is a trademark and service mark of Bloomberg Finance L.P. and its affiliates (collectively “Bloomberg”). Bloomberg or Bloomberg’s licensors own all proprietary rights in the Bloomberg Indices. Bloomberg does not approve or endorse this material or guarantee the accuracy or completeness of any information herein, nor does Bloomberg make any warranty, express or implied, as to the results to be obtained therefrom, and, to the maximum extent allowed by law, Bloomberg shall not have any liability or responsibility for injury or damages arising in connection therewith.
Index performance results do not represent any managed portfolio returns. An investor cannot invest directly in a presented index, as an investment vehicle replicating an index would be required. An index does not charge management fees or brokerage expenses, and no such fees or expenses were deducted from the performance shown.
Funds of private capital funds are speculative and involve a high degree of risk. An investor could lose all or a substantial amount of his or her investment. The asset classes are represented by broad-based indices which have been selected because they are well known and are easily recognizable by investors. Indices have limitations because indices have volatility and other material characteristics that may differ from an actual portfolio. An investor cannot invest directly in a presented index, as an investment vehicle replicating an index would be required. For example, investments made for a portfolio may differ significantly in terms of security holdings, industry weightings and asset allocation from those of the index. Accordingly, investment results and volatility of a portfolio may differ from those of the index referenced. Also, the indices noted in this study are unmanaged, are not available for direct investment, and are not subject to management fees, transaction costs or other types of expenses that a portfolio may incur. In addition, the performance of the indices reflects reinvestment of dividends and, where applicable, capital gain distributions. Therefore, investors should carefully consider these limitations and differences when evaluating the index performance.
The Chartered Financial Analyst® (CFA) designation is a professional certification issued by the CFA Institute to qualified financial analysts who: (i) have a bachelor’s degree and four years of professional experience involving investment decision making or four years of qualified work experience[full time, but not necessarily investment related]; (ii) complete a self‐study program (250 hours of study for each of the three levels); (iii) successfully complete a series of three six‐hour exams; and (iv) pledge to adhere to the CFA Institute Code of Ethics and Standards of Professional Conduct.
The Chartered Alternative Investment Analyst Association® is an independent, not‐for‐profit global organization committed to education and professionalism in the field of alternative investments. Founded in 2002, the CAIA Association is the sponsoring body for the CAIA designation. Recognized globally, the designation certifies one's mastery of the concepts, tools and practices essential for understanding alternative investments and promotes adherence to high standards of professional conduct.
Neither the information nor any opinion expressed in this report constitutes an offer, or an invitation to make an offer, to buy or sell any securities.
Any return expectations provided are not intended as, and must not be regarded as, a representation, warranty or predication that the investment will achieve any particular rate of return over any particular time period or that investors will not incur losses.
Diversification or Asset Allocation does not assure or guarantee better performance and cannot eliminate the risk of investment loss.
Past performance is not indicative of future results.
This blog is prepared for informational purposes only. It does not address specific investment objectives, or the financial situation and the particular needs of any person who may receive this report.
INDICES
The Alerian MLP Index is a composite of the 50 most prominent energy Master Limited Partnerships that provides investors with an unbiased, comprehensive benchmark for this emerging asset class.
The HFRI Monthly Indices (HFRI) are equally weighted performance indexes, compiled by Hedge Fund Research Inc., and are utilized by numerous hedge fund managers as a benchmark for their own hedge funds. The HFRI are broken down into 37 different categories by strategy, including the HFRI Fund Weighted Composite, which accounts for over 2000 funds listed on the internal HFR Database. The HFRI Fund of Funds Composite Index is an equal weighted, net of fee, index composed of approximately 800 fund of funds which report to HFR. See www.hedgefundresearch.com for more information on index construction.
The MSCI ACWI (All Country World Index) Index is a free float-adjusted market capitalization weighted index that is designed to measure the equity market performance of developed and emerging markets. The MSCI ACWI consists of 47 country indexes comprising 23 developed and 24 emerging market country indexes. The developed market country indexes included are: Australia, Austria, Belgium, Canada, Denmark, Finland, France, Germany, Hong Kong, Ireland, Israel, Italy, Japan, Netherlands, New Zealand, Norway, Portugal, Singapore, Spain, Sweden, Switzerland, the United Kingdom and the United States. The emerging market country indexes included are: Brazil, Chile, China, Colombia, Czech Republic, Egypt, Greece, Hungary, India, Indonesia, Korea, Kuwait, Malaysia, Mexico, Peru, Philippines, Poland, Qatar,Saudi Arabia, South Africa, Taiwan, Thailand, Turkey, and United Arab Emirates.
The S&P 500 Index is a capitalization-weighted index of 500 stocks. The S&P 500 Index is designed to measure performance of the broad domestic economy through changes in the aggregate market value of 500 stocks representing all major industries.
Information on any indices mentioned can be obtained either through your advisor or by written request to information@feg.com.
Market Insight
Second Quarter 2024 Market Commentary: The Ten Trillion Dollar Trio
The recent trend of concentration in stock market returns reached staggering new heights in the second quarter, with Nvidia, Microsoft, and Apple accounting for roughly 20% of the S&P 500 index and increasing to a combined market capitalization of $9.7 trillion through quarter-end. For perspective, that is roughly one third of the U.S. gross domestic product of approximately $28 trillion! Several groupings and acronyms for high-flying growth stocks have evolved over time—e.g., FANG, FANMAG, Magnificent Seven—and the persistent success of these three stocks in particular has earned them a new in-house moniker, the “Ten Trillion Dollar Trio.”
The Ten Trillion Dollar Trio achieved their staggering market cap through a combination of strong growth and lofty valuations, Nvidia in particular. The maker of chips essential for the artificial intelligence (AI) boom, Nvidia is an excellent example of being in the right place at the right time. Over the past 12 months, Nvidia’s market cap has seen stunning growth, going from $1 trillion to $3 trillion. Moreover, there is a lot of good news currently priced into the stock, which is trading at 40x forward earnings according to FactSet.
Zooming out to broader markets, global equities, as measured by the MSCI All Country World Index, returned a modest 2.9% in the second quarter. Returns were largely fueled by U.S. large cap growth stocks as well as the aforementioned Ten Trillion Dollar Trio. The Russell 1000 Growth Index—i.e., large cap growth—returned 8.3%, while value and small cap stocks were negative on the quarter. Outside of equities, markets were less exciting during the quarter. Bonds and diversifying strategies eked out modest gains of 0.1% and 0.4%, respectively, as measured by the Bloomberg U.S. Aggregate Bond Index and the HFRI Global Hedge Fund Index. Real assets experienced a decline, with the S&P Real Assets Equity Index posting a quarterly drop of 1.4%.
KEY MARKET THEMES AND DEVELOPMENTS
U.S. Large Cap Equities Unfazed by Economic Slowdown Pressures as
S&P 500 Ascends to Record High
Despite stumbling out of the gates early in the quarter, the S&P 500 Index quickly regained its footing to post a 4.3% total return, adding to an impressive year-to-date gain of 15.3% and setting fresh record high levels along the way.


Indeed, the Bloomberg Magnificent 7 Index posted a 16.9% total return for the quarter and a staggering 37.0% for the first half of the year, versus mediocre performance by the remaining 493 constituents of the S&P 500, which saw a decline of 0.7% in the second quarter and a relatively more modest return of 8.6% for the first half of 2024.
Nvidia, a key global supplier of microchips essential to the adoption and proliferation of AI, has had an outsized influence on the concentration of the run-up in U.S. large cap stocks, with a gain of 36.7% in the second quarter following an 82.5% return in the first quarter. Needless to say, the incredible rise in Nvidia’s stock price caused some pain for portfolio managers and allocators who were underweight the stock—or worse yet, who did not own the company and its ilk versus either the cap-weighted index or growth-oriented peers.
Of course, it behooves investors to not only focus on the prices and valuations attached to the tech-related companies that stand to benefit from the AI boom, but also seek to understand the fundamental picture. Using the same Bloomberg Mag 7 Index data mentioned above and based on available data as of 6/30/2024, there is little comparison between the profitability (net income margin) and earnings growth (trailing 12 months year-over-year growth) for the Mag 7 versus the rest of the market.
Corporate America has also increasingly searched for how to best incorporate AI into their business models or, at a minimum, to better understand AI’s impact on their business lines, customers, and employees. This is evidenced in the number of mentions of AI during S&P 500 companies’ quarterly earnings calls, which has grown sharply since 2022.
The relentless rise in U.S. large cap stocks over the trailing two-year period stirs mixed emotions. On the one hand, the stock market has long been considered a barometer for the overall health, well-being, and general sentiment of both corporate America and consumers. Indeed, many financial market datasets—including consumer sentiment surveys, leading economic indicators, and financial conditions—utilize the stock market to some degree as a variable in the construction of their respective data series.
Moreover, when considering the vast wealth held by retail and institutional investors, sovereign entities, and money managers, one could logically surmise robust stock market performance is the rising tide that lifts all boats. However, just as much of the boom witnessed in the S&P 500 in recent years has been concentrated in a handful of names, the ownership of stocks by the country’s various wealth cohort groups has also clustered in a relatively small number of hands.
As of the first quarter 2024, data from the Federal Reserve Bank of St. Louis shows the top 10% of the wealth distribution owned an astonishing 87% of corporate equities and mutual fund shares, and the top 1% enjoyed nearly a 50% ownership share. The bottom 90% of the wealth distribution, however, owned just 13%, including a paltry 1% ownership by the entire lower half.
Much of the dichotomy between the performances of the stock market and the broader economy in the post-pandemic period serves as a reminder that a large disconnect can sometimes form between Wall Street and Main Street, leading to an increased income and wealth divide and a catalyst for increased societal agitation. Having already reviewed the Wall Street side, now it is time to consider Main Street.
Akin to the performance disparities witnessed across the equity markets in recent years, the U.S. economy has displayed similar conflicting signals. Much like U.S. large cap growth stocks have displayed immense leadership, the U.S. economy has enjoyed a similar position of relative strength.
Looking at economic growth rates in the post-pandemic period, it is easy to see the impressive global leadership exhibited by the U.S. Since the fourth quarter of 2020 and as of first quarter 2024, quarterly real GDP growth in the U.S. has averaged a solid annualized pace of 3.0%. This significantly exceeds the growth rates of many the country’s key trading partners, with similar period readings of 1.4% by Japan, 1.2% by China, and just 0.5% for the euro zone.
On a relative basis, the U.S. has certainly been a standout performer. But much like in the financial markets, considering both the absolute level and the rate-of-change—i.e., “stock versus flow”—is a critical characteristic of a comprehensive analysis.
There is little doubt the absolute reading of the U.S. economy appears in anything but sound standing, as risk assets generally remain bid, credit spreads are tight, inflation has been on a steady downward trajectory, the rise in interest rates has moderated, and the labor market has remained tight, at least up until this year. This seemingly Goldilocks set of conditions helps support the notion the Federal Reserve (Fed) has been successful in reversing the post-pandemic surge in inflation without significantly denting the labor market and broader economy.
As the Fed embarked on their tightening campaign in early 2022, a number of classic recessionary signals began to surface, including the inversion of the Treasury yield curve, a pronounced decline across leading economic indicators, a slump across consumer sentiment and consumer expectations for future conditions, and a manufacturing base mired in contraction since fall 2022. At least during this period, however, the labor market was on a general tightening bias.
The often-cited long and variable lags associated with Fed monetary policy appear to finally be emerging in the U.S. labor market. Nonfarm payrolls, while solid in absolute terms, have witnessed a steady growth rate decline over the trailing year, a notable divergence between the two separate monthly job readings—the establishment and household surveys—has grown since 2022, and the recent steady rise in the unemployment rate.
Through June, the unemployment rate stood at 4.1%, an absolute level that appears subdued by historical standards, but is showing a recent upward bias. Indeed, the 4.1% June rate stood 0.7 percentage points above the cyclical low established in January 2023. Perhaps more importantly, the reported rate has increased above its three-year moving average over the past two months, a signal that historically has been efficacious in helping determine the risks of a cyclical inflection in the economy.
Another recent economic development which has caught the attention of investors is the underwhelming incoming economic data versus Wall Street sell-side estimates. The degree of “misses” displayed by incoming economic data versus that which has been priced into the market through sell-side consensus estimates has deteriorated at an unsettling rate thus far in 2024. Bloomberg’s U.S. Economic Surprise Index, for example, has slumped to a -0.6 z-score, representing the weakest string of incoming data relative to consensus estimates since 2015.
Hope remains, however, for a reversal of fortune in the economic datasets set to be released in the coming months, particularly if the Fed ultimately proves successful in engineering a soft landing—although a determination of that can likely only be made in confidence with the full benefit of hindsight. Hope also does not represent a sound investment strategy, and in light of the growing disparities in both the financial markets and the health of Wall Street versus Main Street, it remains prudent for investors to be on watch for abrupt changes that present both risks and opportunities and stand ready to tactically navigate those waters with precision and humility.
While much excitement has emanated from the public markets in recent quarters, it would be remiss not to comment on the private markets. Activity in the private equity markets has continued to experience a slower pace. Fundraising is on track to come in 18% below 2023 for buyout funds, and investing is off about 8%. While off recent highs, investing in family and founder-owned companies on Main Street is still occurring, though not at the levels seen in recent years. Similar to the public markets, the technology sector is driven by AI-related companies. In the first quarter of 2024, valuations for early-stage AI-related companies were 40% higher than for software companies. The biggest issue in the private equity market continues to be liquidity. With the IPO window generally closed and a limited number of M&A events, managers are looking for creative solutions in the secondary market. GP-led secondary sales were up over 20% in 2023 and are expected to continue growing through 2024.
Private credit funds are relatively more attractive today than they were a year ago. Pricing and terms have shifted strongly in favor of lenders across senior, unitranche, and mezzanine lending. Lenders are now able to provide capital to companies with lower leverage profiles at higher spreads and greater upfront fees than a year ago.
Real asset performance has been mixed in 2024 with AI again influencing market activity. AI applications require greater computing power and the use of AI applications is accelerating. This growth is straining the current data center market and pushing demand for power generation higher – tailwinds which could provide attractive investment opportunities. Higher interest rates and pressure in office space are causing headwinds for private real estate valuations as well as REITs.
REFLECTIONS AND OUTLOOK
As asset allocators, it is unusual to spend a significant amount of time on individual stocks, such as The Ten Trillion Dollar Trio; however, given the concentration by market cap and performance in a small number of stocks, it behooves one to carefully consider them. FEG believes these stocks to be an important part of a diversified portfolio and encourages clients to calibrate ownership relative to a stock’s weight in the market/index. Following this philosophy, on average, the investment team has been modestly underweight the largest handful of stocks in the index. Historically, big returns are made when one owns a stock before it skyrockets to a large weighting in the index rather than after that has occurred.
Of course, picking the winners in advance is no easy feat, so some level of humility and diversification is always a good thing. With that in mind, FEG continues to believe long-term investors’ strategic asset allocation should have a relatively constant risk posture (stocks) and illiquidity budget (private capital) that is prudently acceptable for their unique portfolio objectives. From that starting point, investors can tactically adjust to what the market offers up within investment policy statement (IPS) parameters.
Within public equity, FEG remains modestly underweight the largest stocks in the index, in favor of mid and small cap stocks. Some of this is top-down allocation, and some is through the use of active managers. On the fixed income side, corporate credit spreads are tight, and FEG favors a barbell posture of Treasury bonds and shorter duration positions in structured products and securitized assets. The name of the game in diversifying strategies and private capital is manager selection. The investment team is not willing to sacrifice quality when high conviction managers cannot be found but are quick to invest when such managers are accepting capital.
The team remains ever vigilant in monitoring markets and managers for new opportunities and risks to lean into or out of, respectively. It is also worth remembering that such events do not tend to happen regularly, therefore patience is essential. Small tweaks at the margins are reasonable to conduct more often, but big changes in the market that create the potential for bigger portfolio shifts are rare. Having the discipline to do nothing when there is nothing to do while also remaining nimble enough to react quickly to market volatility is a delicate balancing act. Doing this successfully and compounding capital over the long term is FEG’s goal, and the team remains steadfast in that pursuit. Thank you for your continued confidence and support of FEG.
DISCLOSURES
This report was prepared by FEG (also known as Fund Evaluation Group, LLC), a federally registered investment adviser under the Investment Advisers Act of 1940, as amended, providing non-discretionary and discretionary investment advice to its clients on an individual basis. Registration as an investment adviser does not imply a certain level of skill or training. The oral and written communications of an adviser provide you with information about which you determine to hire or retain an adviser. Fund Evaluation Group, LLC, Form ADV Part 2A & 2B can be obtained by written request directly to: Fund Evaluation Group, LLC, 201 East Fifth Street, Suite 1600, Cincinnati, OH 45202, Attention: Compliance Department.
The information herein was obtained from various sources. FEG does not guarantee the accuracy or completeness of such information provided by third parties. The information in this report is given as of the date indicated and believed to be reliable. FEG assumes no obligation to update this information, or to advise on further developments relating to it. FEG, its affiliates, directors, officers, employees, employee benefit programs and client accounts may have a long position in any securities of issuers discussed in this report.
Bloomberg Index Services Limited. BLOOMBERG® is a trademark and service mark of Bloomberg Finance L.P. and its affiliates (collectively “Bloomberg”). Bloomberg or Bloomberg’s licensors own all proprietary rights in the Bloomberg Indices. Bloomberg does not approve or endorse this material or guarantee the accuracy or completeness of any information herein, nor does Bloomberg make any warranty, express or implied, as to the results to be obtained therefrom, and, to the maximum extent allowed by law, Bloomberg shall not have any liability or responsibility for injury or damages arising in connection therewith.
Index performance results do not represent any managed portfolio returns. An investor cannot invest directly in a presented index, as an investment vehicle replicating an index would be required. An index does not charge management fees or brokerage expenses, and no such fees or expenses were deducted from the performance shown.
Funds of private capital funds are speculative and involve a high degree of risk. An investor could lose all or a substantial amount of his or her investment. The asset classes are represented by broad-based indices which have been selected because they are well known and are easily recognizable by investors. Indices have limitations because indices have volatility and other material characteristics that may differ from an actual portfolio. An investor cannot invest directly in a presented index, as an investment vehicle replicating an index would be required. For example, investments made for a portfolio may differ significantly in terms of security holdings, industry weightings and asset allocation from those of the index. Accordingly, investment results and volatility of a portfolio may differ from those of the index referenced. Also, the indices noted in this study are unmanaged, are not available for direct investment, and are not subject to management fees, transaction costs or other types of expenses that a portfolio may incur. In addition, the performance of the indices reflects reinvestment of dividends and, where applicable, capital gain distributions. Therefore, investors should carefully consider these limitations and differences when evaluating the index performance.
The Chartered Financial Analyst® (CFA) designation is a professional certification issued by the CFA Institute to qualified financial analysts who: (i) have a bachelor’s degree and four years of professional experience involving investment decision making or four years of qualified work experience[full time, but not necessarily investment related]; (ii) complete a self‐study program (250 hours of study for each of the three levels); (iii) successfully complete a series of three six‐hour exams; and (iv) pledge to adhere to the CFA Institute Code of Ethics and Standards of Professional Conduct.
The Chartered Alternative Investment Analyst Association® is an independent, not‐for‐profit global organization committed to education and professionalism in the field of alternative investments. Founded in 2002, the CAIA Association is the sponsoring body for the CAIA designation. Recognized globally, the designation certifies one's mastery of the concepts, tools and practices essential for understanding alternative investments and promotes adherence to high standards of professional conduct.
Neither the information nor any opinion expressed in this report constitutes an offer, or an invitation to make an offer, to buy or sell any securities.
Any return expectations provided are not intended as, and must not be regarded as, a representation, warranty or predication that the investment will achieve any particular rate of return over any particular time period or that investors will not incur losses.
Diversification or Asset Allocation does not assure or guarantee better performance and cannot eliminate the risk of investment loss.
Past performance is not indicative of future results.
This blog is prepared for informational purposes only. It does not address specific investment objectives, or the financial situation and the particular needs of any person who may receive this report.
INDICES
The Alerian MLP Index is a composite of the 50 most prominent energy Master Limited Partnerships that provides investors with an unbiased, comprehensive benchmark for this emerging asset class.
The HFRI Monthly Indices (HFRI) are equally weighted performance indexes, compiled by Hedge Fund Research Inc., and are utilized by numerous hedge fund managers as a benchmark for their own hedge funds. The HFRI are broken down into 37 different categories by strategy, including the HFRI Fund Weighted Composite, which accounts for over 2000 funds listed on the internal HFR Database. The HFRI Fund of Funds Composite Index is an equal weighted, net of fee, index composed of approximately 800 fund of funds which report to HFR. See www.hedgefundresearch.com for more information on index construction.
The MSCI ACWI (All Country World Index) Index is a free float-adjusted market capitalization weighted index that is designed to measure the equity market performance of developed and emerging markets. The MSCI ACWI consists of 47 country indexes comprising 23 developed and 24 emerging market country indexes. The developed market country indexes included are: Australia, Austria, Belgium, Canada, Denmark, Finland, France, Germany, Hong Kong, Ireland, Israel, Italy, Japan, Netherlands, New Zealand, Norway, Portugal, Singapore, Spain, Sweden, Switzerland, the United Kingdom and the United States. The emerging market country indexes included are: Brazil, Chile, China, Colombia, Czech Republic, Egypt, Greece, Hungary, India, Indonesia, Korea, Kuwait, Malaysia, Mexico, Peru, Philippines, Poland, Qatar,Saudi Arabia, South Africa, Taiwan, Thailand, Turkey, and United Arab Emirates.
The S&P 500 Index is a capitalization-weighted index of 500 stocks. The S&P 500 Index is designed to measure performance of the broad domestic economy through changes in the aggregate market value of 500 stocks representing all major industries.
Information on any indices mentioned can be obtained either through your advisor or by written request to information@feg.com.
Recent posts
Subscribe to blog