In literature and theater, comedies and tragedies are two popular genres. At various points in time, markets can appear to be reflective of both. At the end of the third quarter of 2024, the market was reminiscent of the title of William Shakespeare’s famous comedy A Midsummer Night’s Dream. The market was in a rather jovial mood during most of the midsummer nights over the quarter, with notably few tragic sell-offs to worry investors.
However, the ephemeral, dream-like state of the past summer caught some by surprise. The quarter saw the launch of the Federal Reserve’s (Fed) interest rate “normalization” process, as they announced a 50 basis point (bp) cut at the September Federal Open Market Committee (FOMC) meeting. Valuations within the stock market, in particular U.S. large cap stocks, remain elevated. Meanwhile, the U.S. deficit and public debt outstanding continues to grow, with outstanding Treasury debt increasing more than $600 billion on the quarter to $35.5 trillion—or 122% of gross domestic product—and the Treasury budget deficit widening to more than 7% of GDP.
Yet, returns were strong in nearly all corners of the market during the quarter. Global equities, as measured by the MSCI All Country World Index, returned 6.6% in the third quarter. U.S. large cap growth stocks took a breather and let other corners of the stock market lead the way. The Russell 1000 Growth Index—i.e., large cap growth—generated positive results and returned 3.2%, while value, small cap, and non-U.S. stocks all performed well. In conjunction with interest rates declining, core bonds delivered a solid return of 5.2% and diversifying strategies generated a respectable 2.1% return, as measured by the Bloomberg U.S. Aggregate Bond Index and the HFRX Global Hedge Fund Index, respectively. And last, but certainly not least, real assets generated the best results of all major asset classes, with the S&P Real Assets Equity Index posting a quarterly increase of 12.9%.
KEY MARKET THEMES AND DEVELOPMENTS
“Everything Rally” Firmly Takes Hold as Major Central Bank Players Shift Policy Stances
By the end of the third quarter, investors were rewarded for their patience, with positive performance posted across the lion’s share of the major global asset classes, despite an intra-quarter spike in volatility in early August. From stocks to bonds to real assets and hedge funds, few corners of the financial markets saw negative returns for the quarter.
Underpinning these broad-based gains was a notable shift in the policy stances of many of the world’s monetary authorities, with numerous central banks moving away from the multi-year inflation fight toward incrementally less restrictive postures aimed at supporting aggregate demand. While several central banks slashed their respective policy rates during the quarter, the Fed’s 50 bp reduction to the Federal funds rate in September—in addition to forward guidance implying further cuts to come—was particularly embraced by the markets.
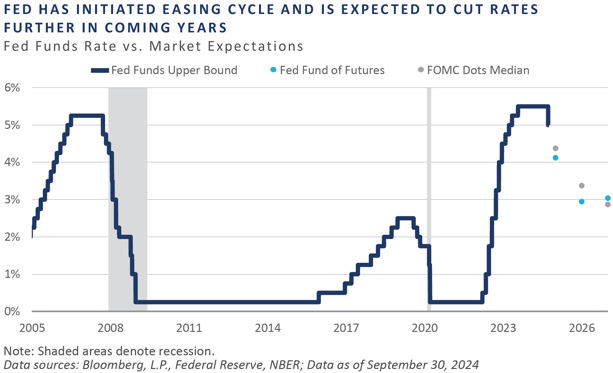
For the remainder of the year, the FOMC has penciled in an additional 50 bps reduction to the policy rate and 100 bps of easing throughout 2025. Through quarter-end, however, the bond market had taken an even more dovish view, with anticipated rate cuts amounting to 75 bps by year-end 2024 and 150 bps of cuts throughout 2025.
While every cycle is distinct, some parallels can be observed. For example, for the two-year period from June 2004 to June 2006, the Fed hiked interest rates a total of 425 bps before pausing for approximately 14 months and ultimately initiating the easing cycle on September 18, 2007, with a 50 bp rate cut.
Fast-forwarding to recent years, the Fed has made a number of changes including: hiked rates 525 bps between March 2022 and July 2023, hit the “pause button” for the 14-month period from July 2023 to September 2024, and kick-started the easing cycle with a 50 bp cut on September 18th—17 years to the day from the Fed’s 2007 pivot. While the conditions for a repeat of the severe recession of 2007-2009 are not present, the duration and magnitude of policy adjustments during these cycles appear oddly similar.
Perhaps more important for investors in the present situation is the notable divergence between the two of the world’s most influential central banks: the Fed and the Bank of Japan (BOJ). While the Fed, Bank of England (BOE), European Central Bank (ECB), and the People's Bank of China (PBOC) have all taken steps to ease monetary conditions, the BOJ has not only tightened policy in recent months but is expected to tighten further in the coming quarters.
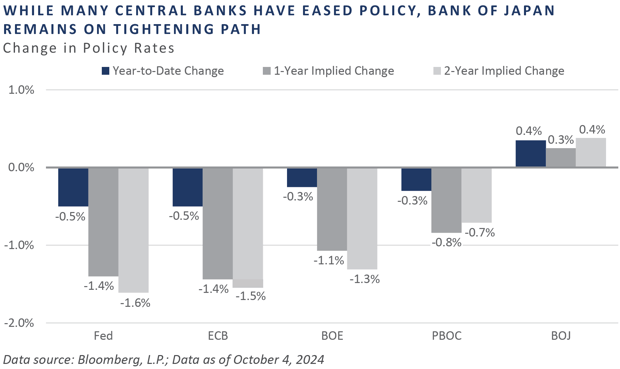
This growing divergence between the policy stances of the Fed and the BOJ, and importantly, the discounted path the financial markets have priced in, fueled a disorderly unwind of the longstanding yen carry trade, which in turn led to a momentary surge in the yen versus the dollar. This surge reached its extreme from early July to mid-September, during which time the yen appreciated approximately 15% against the dollar and contributed to broader volatility across the financial markets.
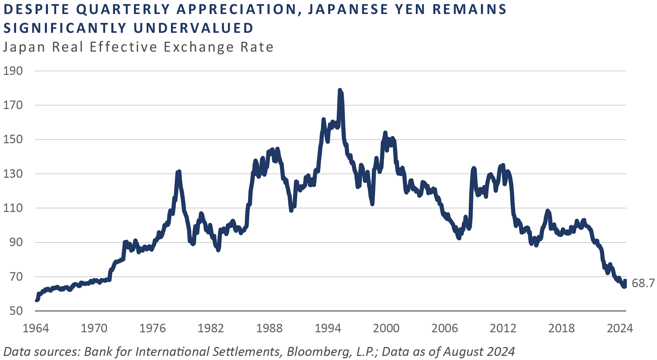
Despite significant appreciation in the yen intra-quarter, much of which can be attributed to its incredibly low base level following a multi-decade decline, on an inflation-adjusted and trade-weighted basis, the yen’s real effective exchange rate—a proxy for a currency’s global relative value—stood near its lowest reading in over 50 years. Since the yen’s peak valuation in 1995, the currency has depreciated more than 60% and is considered one of the weakest currencies within the developed world. Further bouts of yen carry trade volatility should be expected as the Fed migrates further away from its restrictive stance and the BOJ’s inflation fight rages on.
The U.S. dollar’s (USD’s) real effective exchange rate, on the other hand, remains significantly above its long-term trend, with its comparable real effective exchange rate reading approximately 40% higher than levels exhibited in late 2011. With the Fed presumably in policy easing mode for the time being, the path of least resistance for the dollar’s relative value, at least in the short run, appears to be one of potential downside, the bias of which may result in a fruitful opportunity set for international investments, commodities, and other sectors that tend to perform best in a depreciating USD regime.
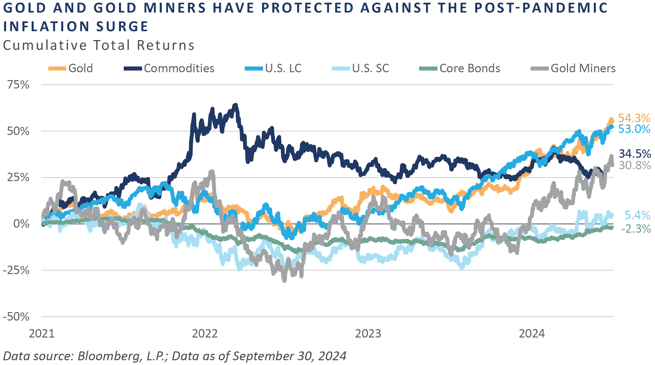
One beneficiary of the anticipation and recent initiation of the Fed pivot was gold, which saw a surge in price in USD terms. During the quarter, the spot price reached a fresh record high, closing at $2,672 per troy ounce on September 26, representing a year-to-date gain of 28%. Moreover, since the Fed’s preferred gauge of inflation, the core personal consumption expenditure (PCE), moved above its 2% target in March 2021, gold—and to a lesser extent, gold mining stocks—has proven efficacious in protecting against the increase in inflation, with performance strongly exceeding the increases witnessed across the core PCE index over the same period.
Pivots from several major central banks, save for the BOJ, have placed downward pressure on short-term interest rates—a welcomed development for both the U.S. Department of the Treasury and investors. As the government’s debt burden has surged in the post-pandemic period and interest rates have risen to multi-decade highs, the Treasury’s interest expense has swelled, contributing to the budget deficits the Treasury currently faces.
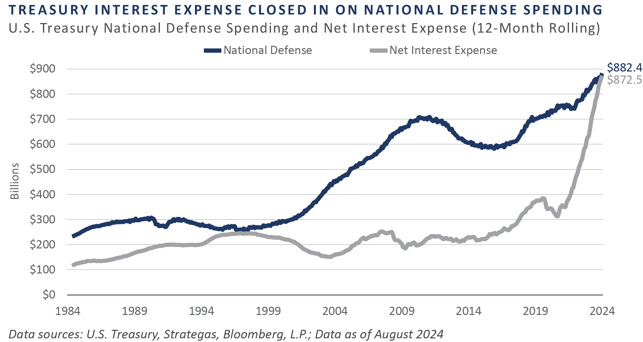
This combination of a rising debt burden in conjunction with high levels of interest has resulted in a surge in the country’s spending on interest to service this burden. Through August, the Treasury Department’s trailing 12-months spending on national defense stood just north of $880 billion, with net interest paid on outstanding Treasury obligations closing in on this line-item expense, a dynamic that has not been observed in the past two decades.
Despite its seemingly unsustainable trajectory, it is hard to deny the strength exhibited by the U.S. economy during the post-pandemic period. While other major economies such as China, Japan, the European Union, and the United Kingdom have grappled with fundamental economic challenges in recent years, the U.S. has served as a bright spot.
In addition to record high stock prices, corporate profits remain elevated, real GDP growth has coalesced around a solid 3% annual pace, home prices and homeowners’ equity appear lofty, credit risk premiums remain historically tight, unemployment claims have been subdued of late, and both inflation and Treasury interest rates have trended lower over the past year. This benign macro backdrop has aided in keeping broader financial conditions loose versus historical averages and has also aided in driving conditions to even easier levels over the past two years, despite one of the most aggressive Fed tightening campaigns since the 1970-1980 inflationary period.
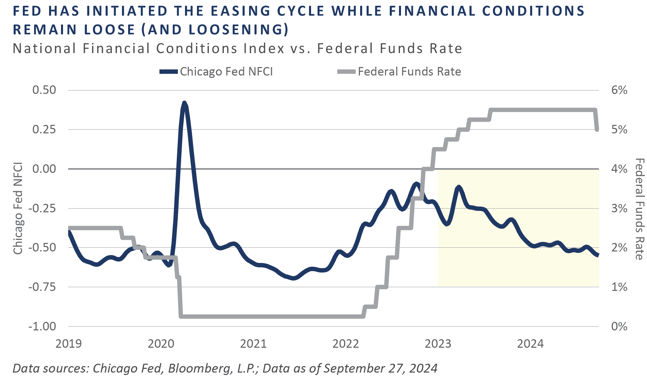
While financial conditions are loose and loosening, this may present a conundrum for both policymakers and investors. And while inflation has trended lower since late 2022, most commonly referenced gauges remain above the Fed’s 2% bogey. With the Fed turning away from its policy-restraining initiatives in September with a 50 bp rate cut—and setting forth forward guidance that points to a further easing in its stance in the coming years—the risk of a second wave of inflationary pressures cannot be ignored.
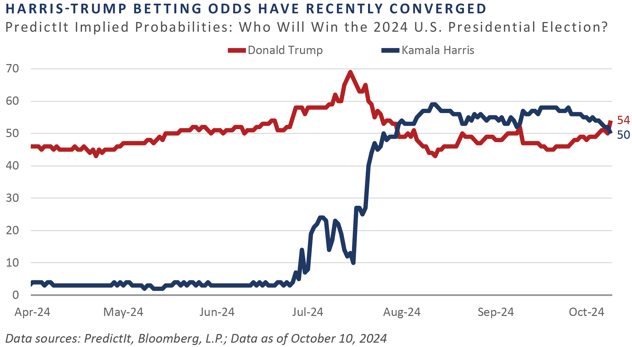
Further complicating the picture of what lies ahead for the U.S. economy and its respective financial market sectors is the upcoming U.S. presidential election, with betting odds currently implying a notably tight outcome. With no clear winner appearing evident less than 3 weeks to election day, the potential for a revival of financial market volatility—and an associated broadening in the opportunity set worthy of a flexing of risk budgets—remains a possibility.
Evolving Trends Across the Private Markets
Private equity activity continues to experience a more rational pace compared to 2020 and 2021. Exit and deal activity has increased modestly in 2024 and is on track to exceed last year’s level, albeit still well below the peak in 2021. The technology sector continues to struggle on the exit front as liquidity remains the biggest challenge. With the IPO window generally closed and a limited number of M&A events, managers are looking for creative solutions in the secondary market. GP-led secondary sales are expected to continue growing through 2024.
Fundraising for private credit funds is on track to be over $200 billion this year, the fifth straight year with over $200 billion raised. Private debt has generated more stable returns in recent years, but it is primarily comprised of floating rate debt, which means it will likely be strongly affected by Fed interest rate cuts. Contributing factors to private debt fundraising have included relatively stable distribution rates and private debt’s risk-return profile.
Real asset performance has been mixed in 2024 with higher rates and pressure in office space challenging real estate funds. Digital infrastructure continues to gain traction in the market, with data centers and their required power generation remaining a popular theme among real asset investors. Another major theme is spectrum licenses, as the rollout of the 5G network by the major cell phone carriers is expected to drive the need for additional spectrum to carry data through the network.
REFLECTIONS AND OUTLOOK
While the markets may seem like a comedy at present, history is proof that they can turn into a tragedy at a moment's notice. While it is not prudent to face markets or invest in a continual state of fear, a healthy dose of skepticism is usually a good character trait for an investor. Too much greed can lead to tragic downfalls, and too much fear can cause investors to miss out on the show altogether; too strong a bias in either direction can make investors feel foolish.
Ultimately, FEG aims to balance fear and greed in the current market environment by staying relatively close to long-term policy asset allocation and holding the line. Within equities, the team is spending more time on small cap, which is beginning to show signs of life after several lean years of meager returns. Fixed income offers some reasonable return prospects; however, corporate credit spreads are tight and do not offer much in the way of a margin of safety. As such, Treasuries are a good place to hang out and wait for better opportunities across the credit markets. Additionally, the consumer’s balance sheet appears in reasonably strong standing, given rising household net worth and elevated FICO scores, which means asset-backed bonds tied to the consumer are offering relatively safe incremental yield.
Similar to Shakespearian characters falling in and out of love, asset allocators seem to be developing a love/hate relationship with private capital. During most of the 2010s, the larger the allocation to private capital, the better a portfolio performed. While over the past two years, public markets outperformed private markets. Ultimately, FEG believes those with skill in manager selection will be well served over the long term by sticking with an allocation to private capital. In the near term, however, the abundance of hate vs. love for private capital is creating opportunities for patient long-term investors in secondaries and co-investments.
The goal for investors is to stick to the script and not emotionally overreact to recent events. This is easier said than done though, as “recent events” will likely persist for much longer than expected. Or, as John Maynard Keynes once observed, “Markets can remain irrational longer than I can remain solvent.” This is a cautionary tale to help investors recognize their behavioral biases and acknowledge that markets can be swept up in the madness of crowds and move in ways that no one could have foretold. Finally, it is important to remember that some element of humility in portfolio position sizing is critical to survive both short-term mistakes and market manias and eventually succeed over the long term. This is why FEG seeks to have breadth of active risk and find multiple ways to win. The team is constantly working towards this goal as a part of the firm’s process and trusts that process will lead to the desired outcomes. Thank you for your continued confidence in and support of FEG and our process.
DISCLOSURES
This report was prepared by FEG (also known as Fund Evaluation Group, LLC), a federally registered investment adviser under the Investment Advisers Act of 1940, as amended, providing non-discretionary and discretionary investment advice to its clients on an individual basis. Registration as an investment adviser does not imply a certain level of skill or training. The oral and written communications of an adviser provide you with information about which you determine to hire or retain an adviser. Fund Evaluation Group, LLC, Form ADV Part 2A & 2B can be obtained by written request directly to: Fund Evaluation Group, LLC, 201 East Fifth Street, Suite 1600, Cincinnati, OH 45202, Attention: Compliance Department.
The information herein was obtained from various sources. FEG does not guarantee the accuracy or completeness of such information provided by third parties. The information in this report is given as of the date indicated and believed to be reliable. FEG assumes no obligation to update this information, or to advise on further developments relating to it. FEG, its affiliates, directors, officers, employees, employee benefit programs and client accounts may have a long position in any securities of issuers discussed in this report.
Bloomberg Index Services Limited. BLOOMBERG® is a trademark and service mark of Bloomberg Finance L.P. and its affiliates (collectively “Bloomberg”). Bloomberg or Bloomberg’s licensors own all proprietary rights in the Bloomberg Indices. Bloomberg does not approve or endorse this material or guarantee the accuracy or completeness of any information herein, nor does Bloomberg make any warranty, express or implied, as to the results to be obtained therefrom, and, to the maximum extent allowed by law, Bloomberg shall not have any liability or responsibility for injury or damages arising in connection therewith.
Index performance results do not represent any managed portfolio returns. An investor cannot invest directly in a presented index, as an investment vehicle replicating an index would be required. An index does not charge management fees or brokerage expenses, and no such fees or expenses were deducted from the performance shown.
Funds of private capital funds are speculative and involve a high degree of risk. An investor could lose all or a substantial amount of his or her investment. The asset classes are represented by broad-based indices which have been selected because they are well known and are easily recognizable by investors. Indices have limitations because indices have volatility and other material characteristics that may differ from an actual portfolio. An investor cannot invest directly in a presented index, as an investment vehicle replicating an index would be required. For example, investments made for a portfolio may differ significantly in terms of security holdings, industry weightings and asset allocation from those of the index. Accordingly, investment results and volatility of a portfolio may differ from those of the index referenced. Also, the indices noted in this study are unmanaged, are not available for direct investment, and are not subject to management fees, transaction costs or other types of expenses that a portfolio may incur. In addition, the performance of the indices reflects reinvestment of dividends and, where applicable, capital gain distributions. Therefore, investors should carefully consider these limitations and differences when evaluating the index performance.
The Chartered Financial Analyst® (CFA) designation is a professional certification issued by the CFA Institute to qualified financial analysts who: (i) have a bachelor’s degree and four years of professional experience involving investment decision making or four years of qualified work experience[full time, but not necessarily investment related]; (ii) complete a self‐study program (250 hours of study for each of the three levels); (iii) successfully complete a series of three six‐hour exams; and (iv) pledge to adhere to the CFA Institute Code of Ethics and Standards of Professional Conduct.
The Chartered Alternative Investment Analyst Association® is an independent, not‐for‐profit global organization committed to education and professionalism in the field of alternative investments. Founded in 2002, the CAIA Association is the sponsoring body for the CAIA designation. Recognized globally, the designation certifies one's mastery of the concepts, tools and practices essential for understanding alternative investments and promotes adherence to high standards of professional conduct.
Neither the information nor any opinion expressed in this report constitutes an offer, or an invitation to make an offer, to buy or sell any securities.
Any return expectations provided are not intended as, and must not be regarded as, a representation, warranty or predication that the investment will achieve any particular rate of return over any particular time period or that investors will not incur losses.
Diversification or Asset Allocation does not assure or guarantee better performance and cannot eliminate the risk of investment loss.
Past performance is not indicative of future results.
This blog is prepared for informational purposes only. It does not address specific investment objectives, or the financial situation and the particular needs of any person who may receive this report.
INDICES
The Alerian MLP Index is a composite of the 50 most prominent energy Master Limited Partnerships that provides investors with an unbiased, comprehensive benchmark for this emerging asset class.
The HFRI Monthly Indices (HFRI) are equally weighted performance indexes, compiled by Hedge Fund Research Inc., and are utilized by numerous hedge fund managers as a benchmark for their own hedge funds. The HFRI are broken down into 37 different categories by strategy, including the HFRI Fund Weighted Composite, which accounts for over 2000 funds listed on the internal HFR Database. The HFRI Fund of Funds Composite Index is an equal weighted, net of fee, index composed of approximately 800 fund of funds which report to HFR. See www.hedgefundresearch.com for more information on index construction.
The MSCI ACWI (All Country World Index) Index is a free float-adjusted market capitalization weighted index that is designed to measure the equity market performance of developed and emerging markets. The MSCI ACWI consists of 47 country indexes comprising 23 developed and 24 emerging market country indexes. The developed market country indexes included are: Australia, Austria, Belgium, Canada, Denmark, Finland, France, Germany, Hong Kong, Ireland, Israel, Italy, Japan, Netherlands, New Zealand, Norway, Portugal, Singapore, Spain, Sweden, Switzerland, the United Kingdom and the United States. The emerging market country indexes included are: Brazil, Chile, China, Colombia, Czech Republic, Egypt, Greece, Hungary, India, Indonesia, Korea, Kuwait, Malaysia, Mexico, Peru, Philippines, Poland, Qatar,Saudi Arabia, South Africa, Taiwan, Thailand, Turkey, and United Arab Emirates.
The S&P 500 Index is a capitalization-weighted index of 500 stocks. The S&P 500 Index is designed to measure performance of the broad domestic economy through changes in the aggregate market value of 500 stocks representing all major industries.
Information on any indices mentioned can be obtained either through your advisor or by written request to information@feg.com.
Market Insight
Third Quarter 2024 Market Commentary: A Midsummer Night's Dream
In literature and theater, comedies and tragedies are two popular genres. At various points in time, markets can appear to be reflective of both. At the end of the third quarter of 2024, the market was reminiscent of the title of William Shakespeare’s famous comedy A Midsummer Night’s Dream. The market was in a rather jovial mood during most of the midsummer nights over the quarter, with notably few tragic sell-offs to worry investors.
However, the ephemeral, dream-like state of the past summer caught some by surprise. The quarter saw the launch of the Federal Reserve’s (Fed) interest rate “normalization” process, as they announced a 50 basis point (bp) cut at the September Federal Open Market Committee (FOMC) meeting. Valuations within the stock market, in particular U.S. large cap stocks, remain elevated. Meanwhile, the U.S. deficit and public debt outstanding continues to grow, with outstanding Treasury debt increasing more than $600 billion on the quarter to $35.5 trillion—or 122% of gross domestic product—and the Treasury budget deficit widening to more than 7% of GDP.
Yet, returns were strong in nearly all corners of the market during the quarter. Global equities, as measured by the MSCI All Country World Index, returned 6.6% in the third quarter. U.S. large cap growth stocks took a breather and let other corners of the stock market lead the way. The Russell 1000 Growth Index—i.e., large cap growth—generated positive results and returned 3.2%, while value, small cap, and non-U.S. stocks all performed well. In conjunction with interest rates declining, core bonds delivered a solid return of 5.2% and diversifying strategies generated a respectable 2.1% return, as measured by the Bloomberg U.S. Aggregate Bond Index and the HFRX Global Hedge Fund Index, respectively. And last, but certainly not least, real assets generated the best results of all major asset classes, with the S&P Real Assets Equity Index posting a quarterly increase of 12.9%.
KEY MARKET THEMES AND DEVELOPMENTS
“Everything Rally” Firmly Takes Hold as Major Central Bank Players Shift Policy Stances
By the end of the third quarter, investors were rewarded for their patience, with positive performance posted across the lion’s share of the major global asset classes, despite an intra-quarter spike in volatility in early August. From stocks to bonds to real assets and hedge funds, few corners of the financial markets saw negative returns for the quarter.


Underpinning these broad-based gains was a notable shift in the policy stances of many of the world’s monetary authorities, with numerous central banks moving away from the multi-year inflation fight toward incrementally less restrictive postures aimed at supporting aggregate demand. While several central banks slashed their respective policy rates during the quarter, the Fed’s 50 bp reduction to the Federal funds rate in September—in addition to forward guidance implying further cuts to come—was particularly embraced by the markets.
For the remainder of the year, the FOMC has penciled in an additional 50 bps reduction to the policy rate and 100 bps of easing throughout 2025. Through quarter-end, however, the bond market had taken an even more dovish view, with anticipated rate cuts amounting to 75 bps by year-end 2024 and 150 bps of cuts throughout 2025.
While every cycle is distinct, some parallels can be observed. For example, for the two-year period from June 2004 to June 2006, the Fed hiked interest rates a total of 425 bps before pausing for approximately 14 months and ultimately initiating the easing cycle on September 18, 2007, with a 50 bp rate cut.
Fast-forwarding to recent years, the Fed has made a number of changes including: hiked rates 525 bps between March 2022 and July 2023, hit the “pause button” for the 14-month period from July 2023 to September 2024, and kick-started the easing cycle with a 50 bp cut on September 18th—17 years to the day from the Fed’s 2007 pivot. While the conditions for a repeat of the severe recession of 2007-2009 are not present, the duration and magnitude of policy adjustments during these cycles appear oddly similar.
Perhaps more important for investors in the present situation is the notable divergence between the two of the world’s most influential central banks: the Fed and the Bank of Japan (BOJ). While the Fed, Bank of England (BOE), European Central Bank (ECB), and the People's Bank of China (PBOC) have all taken steps to ease monetary conditions, the BOJ has not only tightened policy in recent months but is expected to tighten further in the coming quarters.
This growing divergence between the policy stances of the Fed and the BOJ, and importantly, the discounted path the financial markets have priced in, fueled a disorderly unwind of the longstanding yen carry trade, which in turn led to a momentary surge in the yen versus the dollar. This surge reached its extreme from early July to mid-September, during which time the yen appreciated approximately 15% against the dollar and contributed to broader volatility across the financial markets.
Despite significant appreciation in the yen intra-quarter, much of which can be attributed to its incredibly low base level following a multi-decade decline, on an inflation-adjusted and trade-weighted basis, the yen’s real effective exchange rate—a proxy for a currency’s global relative value—stood near its lowest reading in over 50 years. Since the yen’s peak valuation in 1995, the currency has depreciated more than 60% and is considered one of the weakest currencies within the developed world. Further bouts of yen carry trade volatility should be expected as the Fed migrates further away from its restrictive stance and the BOJ’s inflation fight rages on.
The U.S. dollar’s (USD’s) real effective exchange rate, on the other hand, remains significantly above its long-term trend, with its comparable real effective exchange rate reading approximately 40% higher than levels exhibited in late 2011. With the Fed presumably in policy easing mode for the time being, the path of least resistance for the dollar’s relative value, at least in the short run, appears to be one of potential downside, the bias of which may result in a fruitful opportunity set for international investments, commodities, and other sectors that tend to perform best in a depreciating USD regime.
One beneficiary of the anticipation and recent initiation of the Fed pivot was gold, which saw a surge in price in USD terms. During the quarter, the spot price reached a fresh record high, closing at $2,672 per troy ounce on September 26, representing a year-to-date gain of 28%. Moreover, since the Fed’s preferred gauge of inflation, the core personal consumption expenditure (PCE), moved above its 2% target in March 2021, gold—and to a lesser extent, gold mining stocks—has proven efficacious in protecting against the increase in inflation, with performance strongly exceeding the increases witnessed across the core PCE index over the same period.
Pivots from several major central banks, save for the BOJ, have placed downward pressure on short-term interest rates—a welcomed development for both the U.S. Department of the Treasury and investors. As the government’s debt burden has surged in the post-pandemic period and interest rates have risen to multi-decade highs, the Treasury’s interest expense has swelled, contributing to the budget deficits the Treasury currently faces.
This combination of a rising debt burden in conjunction with high levels of interest has resulted in a surge in the country’s spending on interest to service this burden. Through August, the Treasury Department’s trailing 12-months spending on national defense stood just north of $880 billion, with net interest paid on outstanding Treasury obligations closing in on this line-item expense, a dynamic that has not been observed in the past two decades.
Despite its seemingly unsustainable trajectory, it is hard to deny the strength exhibited by the U.S. economy during the post-pandemic period. While other major economies such as China, Japan, the European Union, and the United Kingdom have grappled with fundamental economic challenges in recent years, the U.S. has served as a bright spot.
In addition to record high stock prices, corporate profits remain elevated, real GDP growth has coalesced around a solid 3% annual pace, home prices and homeowners’ equity appear lofty, credit risk premiums remain historically tight, unemployment claims have been subdued of late, and both inflation and Treasury interest rates have trended lower over the past year. This benign macro backdrop has aided in keeping broader financial conditions loose versus historical averages and has also aided in driving conditions to even easier levels over the past two years, despite one of the most aggressive Fed tightening campaigns since the 1970-1980 inflationary period.
While financial conditions are loose and loosening, this may present a conundrum for both policymakers and investors. And while inflation has trended lower since late 2022, most commonly referenced gauges remain above the Fed’s 2% bogey. With the Fed turning away from its policy-restraining initiatives in September with a 50 bp rate cut—and setting forth forward guidance that points to a further easing in its stance in the coming years—the risk of a second wave of inflationary pressures cannot be ignored.
Further complicating the picture of what lies ahead for the U.S. economy and its respective financial market sectors is the upcoming U.S. presidential election, with betting odds currently implying a notably tight outcome. With no clear winner appearing evident less than 3 weeks to election day, the potential for a revival of financial market volatility—and an associated broadening in the opportunity set worthy of a flexing of risk budgets—remains a possibility.
Evolving Trends Across the Private Markets
Private equity activity continues to experience a more rational pace compared to 2020 and 2021. Exit and deal activity has increased modestly in 2024 and is on track to exceed last year’s level, albeit still well below the peak in 2021. The technology sector continues to struggle on the exit front as liquidity remains the biggest challenge. With the IPO window generally closed and a limited number of M&A events, managers are looking for creative solutions in the secondary market. GP-led secondary sales are expected to continue growing through 2024.
Fundraising for private credit funds is on track to be over $200 billion this year, the fifth straight year with over $200 billion raised. Private debt has generated more stable returns in recent years, but it is primarily comprised of floating rate debt, which means it will likely be strongly affected by Fed interest rate cuts. Contributing factors to private debt fundraising have included relatively stable distribution rates and private debt’s risk-return profile.
Real asset performance has been mixed in 2024 with higher rates and pressure in office space challenging real estate funds. Digital infrastructure continues to gain traction in the market, with data centers and their required power generation remaining a popular theme among real asset investors. Another major theme is spectrum licenses, as the rollout of the 5G network by the major cell phone carriers is expected to drive the need for additional spectrum to carry data through the network.
REFLECTIONS AND OUTLOOK
While the markets may seem like a comedy at present, history is proof that they can turn into a tragedy at a moment's notice. While it is not prudent to face markets or invest in a continual state of fear, a healthy dose of skepticism is usually a good character trait for an investor. Too much greed can lead to tragic downfalls, and too much fear can cause investors to miss out on the show altogether; too strong a bias in either direction can make investors feel foolish.
Ultimately, FEG aims to balance fear and greed in the current market environment by staying relatively close to long-term policy asset allocation and holding the line. Within equities, the team is spending more time on small cap, which is beginning to show signs of life after several lean years of meager returns. Fixed income offers some reasonable return prospects; however, corporate credit spreads are tight and do not offer much in the way of a margin of safety. As such, Treasuries are a good place to hang out and wait for better opportunities across the credit markets. Additionally, the consumer’s balance sheet appears in reasonably strong standing, given rising household net worth and elevated FICO scores, which means asset-backed bonds tied to the consumer are offering relatively safe incremental yield.
Similar to Shakespearian characters falling in and out of love, asset allocators seem to be developing a love/hate relationship with private capital. During most of the 2010s, the larger the allocation to private capital, the better a portfolio performed. While over the past two years, public markets outperformed private markets. Ultimately, FEG believes those with skill in manager selection will be well served over the long term by sticking with an allocation to private capital. In the near term, however, the abundance of hate vs. love for private capital is creating opportunities for patient long-term investors in secondaries and co-investments.
The goal for investors is to stick to the script and not emotionally overreact to recent events. This is easier said than done though, as “recent events” will likely persist for much longer than expected. Or, as John Maynard Keynes once observed, “Markets can remain irrational longer than I can remain solvent.” This is a cautionary tale to help investors recognize their behavioral biases and acknowledge that markets can be swept up in the madness of crowds and move in ways that no one could have foretold. Finally, it is important to remember that some element of humility in portfolio position sizing is critical to survive both short-term mistakes and market manias and eventually succeed over the long term. This is why FEG seeks to have breadth of active risk and find multiple ways to win. The team is constantly working towards this goal as a part of the firm’s process and trusts that process will lead to the desired outcomes. Thank you for your continued confidence in and support of FEG and our process.
DISCLOSURES
This report was prepared by FEG (also known as Fund Evaluation Group, LLC), a federally registered investment adviser under the Investment Advisers Act of 1940, as amended, providing non-discretionary and discretionary investment advice to its clients on an individual basis. Registration as an investment adviser does not imply a certain level of skill or training. The oral and written communications of an adviser provide you with information about which you determine to hire or retain an adviser. Fund Evaluation Group, LLC, Form ADV Part 2A & 2B can be obtained by written request directly to: Fund Evaluation Group, LLC, 201 East Fifth Street, Suite 1600, Cincinnati, OH 45202, Attention: Compliance Department.
The information herein was obtained from various sources. FEG does not guarantee the accuracy or completeness of such information provided by third parties. The information in this report is given as of the date indicated and believed to be reliable. FEG assumes no obligation to update this information, or to advise on further developments relating to it. FEG, its affiliates, directors, officers, employees, employee benefit programs and client accounts may have a long position in any securities of issuers discussed in this report.
Bloomberg Index Services Limited. BLOOMBERG® is a trademark and service mark of Bloomberg Finance L.P. and its affiliates (collectively “Bloomberg”). Bloomberg or Bloomberg’s licensors own all proprietary rights in the Bloomberg Indices. Bloomberg does not approve or endorse this material or guarantee the accuracy or completeness of any information herein, nor does Bloomberg make any warranty, express or implied, as to the results to be obtained therefrom, and, to the maximum extent allowed by law, Bloomberg shall not have any liability or responsibility for injury or damages arising in connection therewith.
Index performance results do not represent any managed portfolio returns. An investor cannot invest directly in a presented index, as an investment vehicle replicating an index would be required. An index does not charge management fees or brokerage expenses, and no such fees or expenses were deducted from the performance shown.
Funds of private capital funds are speculative and involve a high degree of risk. An investor could lose all or a substantial amount of his or her investment. The asset classes are represented by broad-based indices which have been selected because they are well known and are easily recognizable by investors. Indices have limitations because indices have volatility and other material characteristics that may differ from an actual portfolio. An investor cannot invest directly in a presented index, as an investment vehicle replicating an index would be required. For example, investments made for a portfolio may differ significantly in terms of security holdings, industry weightings and asset allocation from those of the index. Accordingly, investment results and volatility of a portfolio may differ from those of the index referenced. Also, the indices noted in this study are unmanaged, are not available for direct investment, and are not subject to management fees, transaction costs or other types of expenses that a portfolio may incur. In addition, the performance of the indices reflects reinvestment of dividends and, where applicable, capital gain distributions. Therefore, investors should carefully consider these limitations and differences when evaluating the index performance.
The Chartered Financial Analyst® (CFA) designation is a professional certification issued by the CFA Institute to qualified financial analysts who: (i) have a bachelor’s degree and four years of professional experience involving investment decision making or four years of qualified work experience[full time, but not necessarily investment related]; (ii) complete a self‐study program (250 hours of study for each of the three levels); (iii) successfully complete a series of three six‐hour exams; and (iv) pledge to adhere to the CFA Institute Code of Ethics and Standards of Professional Conduct.
The Chartered Alternative Investment Analyst Association® is an independent, not‐for‐profit global organization committed to education and professionalism in the field of alternative investments. Founded in 2002, the CAIA Association is the sponsoring body for the CAIA designation. Recognized globally, the designation certifies one's mastery of the concepts, tools and practices essential for understanding alternative investments and promotes adherence to high standards of professional conduct.
Neither the information nor any opinion expressed in this report constitutes an offer, or an invitation to make an offer, to buy or sell any securities.
Any return expectations provided are not intended as, and must not be regarded as, a representation, warranty or predication that the investment will achieve any particular rate of return over any particular time period or that investors will not incur losses.
Diversification or Asset Allocation does not assure or guarantee better performance and cannot eliminate the risk of investment loss.
Past performance is not indicative of future results.
This blog is prepared for informational purposes only. It does not address specific investment objectives, or the financial situation and the particular needs of any person who may receive this report.
INDICES
The Alerian MLP Index is a composite of the 50 most prominent energy Master Limited Partnerships that provides investors with an unbiased, comprehensive benchmark for this emerging asset class.
The HFRI Monthly Indices (HFRI) are equally weighted performance indexes, compiled by Hedge Fund Research Inc., and are utilized by numerous hedge fund managers as a benchmark for their own hedge funds. The HFRI are broken down into 37 different categories by strategy, including the HFRI Fund Weighted Composite, which accounts for over 2000 funds listed on the internal HFR Database. The HFRI Fund of Funds Composite Index is an equal weighted, net of fee, index composed of approximately 800 fund of funds which report to HFR. See www.hedgefundresearch.com for more information on index construction.
The MSCI ACWI (All Country World Index) Index is a free float-adjusted market capitalization weighted index that is designed to measure the equity market performance of developed and emerging markets. The MSCI ACWI consists of 47 country indexes comprising 23 developed and 24 emerging market country indexes. The developed market country indexes included are: Australia, Austria, Belgium, Canada, Denmark, Finland, France, Germany, Hong Kong, Ireland, Israel, Italy, Japan, Netherlands, New Zealand, Norway, Portugal, Singapore, Spain, Sweden, Switzerland, the United Kingdom and the United States. The emerging market country indexes included are: Brazil, Chile, China, Colombia, Czech Republic, Egypt, Greece, Hungary, India, Indonesia, Korea, Kuwait, Malaysia, Mexico, Peru, Philippines, Poland, Qatar,Saudi Arabia, South Africa, Taiwan, Thailand, Turkey, and United Arab Emirates.
The S&P 500 Index is a capitalization-weighted index of 500 stocks. The S&P 500 Index is designed to measure performance of the broad domestic economy through changes in the aggregate market value of 500 stocks representing all major industries.
Information on any indices mentioned can be obtained either through your advisor or by written request to information@feg.com.
Recent posts
Subscribe to blog